
Getting Started
RaceMetrics is a comprehensive horse racing analytics platform that helps you track and analyse performance across all key racing participants. Whether you're interested in horses, trainers, jockeys, sires, dams, damsires, or owners, RaceMetrics provides detailed statistics and insights.
Key Features
- Performance Ratings: Proprietary ratings updated after every race
- Leaderboards: See top performers across all 7 profile types
- Pattern Discovery: Save profitable angles and get alerts when they match
- Enhanced Racecards: Full analysis with confidence ratings
- P/L Tracking: Betfair SP profit/loss analysis
- RM7 Competition: Free weekly skill-based competition with cash prizes
Profile Types
RaceMetrics tracks seven distinct profile types, each with full statistics, form analysis, and P/L tracking:
- Horses: Individual horse performance and form
- Trainers: Trainer statistics and yard form
- Jockeys: Jockey performance and booking patterns
- Sires: Stallion progeny performance
- Dams: Mare offspring performance
- Damsires: Maternal grandsire influence
- Owners: Owner racing statistics
RaceMetrics ratings are our proprietary performance measure designed to track form over time. Unlike traditional ratings that focus only on horses, our system rates all participant types.
Rating Scale
- 1600+: Elite level - exceptional performers
- 1550+: High performing - consistently above average
- 1500: Average performance level
- Below 1450: Below average - struggling form
Combined Score
The Combined Score is a weighted average of all 6 connection ratings (Owner, Trainer, Jockey, Dam, Sire, Damsire). This provides a single number that captures the overall quality of a horse's connections.
Weighting: Owner 20%, Trainer 20%, Jockey 20%, Dam 18%, Sire 12%, Damsire 10%
Combined Score Win Rates
Historical analysis shows clear correlation between Combined Score and win probability:
| Tier | Score Range | Win % | vs Random |
|---|---|---|---|
| Elite | 1600+ | 43.75% | 3.54x |
| Very High | 1575-1599 | 33.41% | 3.18x |
| High | 1550-1574 | 24.06% | 2.49x |
| Above Avg | 1525-1549 | 17.78% | 1.86x |
| Average | 1500-1524 | 12.38% | 1.32x |
| Below Avg | 1475-1499 | 7.99% | 0.87x |
| Low | 1450-1474 | 4.95% | 0.54x |
| Bottom | Under 1450 | 2.81% | 0.30x |
Top Score in Race: The horse with the highest Combined Score in each race wins 22.97% of the time (2.15x random).
How Ratings Update
Ratings are recalculated after every race based on actual performance. When a participant runs, their rating adjusts based on:
- Finishing position relative to expectations
- Quality of opposition faced
- Race conditions and class
Rating Changes
The "Biggest Movers" section on the dashboard highlights participants whose ratings have changed significantly. Green indicators show rising form, while red indicates declining performance.
Features
The main dashboard provides leaderboards for all seven profile types, showing the top performers ranked by RaceMetrics rating.
Navigation
Every page has a navigation bar just below the header. Everything is grouped into five menus — hover over each one (or tap it on mobile) to open it:
- Racecards: today's & upcoming cards, plus Runners A–Z, Non-Runners, Pattern Manager, Tips, Weather Centre, Going Predictor, Meeting Pace, Sectionals, AI Race Cards and Best Fits
- System Builder: the System Builder back-tester, Today's Qualifiers, Portfolio & Compare and Ask RaceMetrics
- Profiles: leaderboards for Horses, Trainers, Jockeys, Owners, Sires, Dams and Damsires
- Tips: the daily RaceMetrics Tips
- RM7: the free weekly competition
On a phone the same five menus sit in a bar fixed to the bottom of the screen (Racecards · Profiles · Build · Tips · RM7) — tap any one to open its list. The hamburger icon (top-left) also opens a full menu of every page.
Filtering Options
- Search: Find specific participants by name. Toggle between "Contains" (matches anywhere in name) or "Begins" (matches start of name) search modes
- Activity: Filter to participants with races in a recent period - 7, 14, 30, 90, or 365 days. Default is 90 days
- Min Races: Filter out participants with few runs (e.g., 10+, 50+, 100+, 500+). Options vary by profile type
- Type: Filter by Flat or Jumps racing (available for Trainers and Jockeys tabs only)
Stats Cards
Three summary cards appear above the leaderboard showing:
- Total: Number of participants matching current filters
- Highest: The top rating in the current leaderboard
- Average: Mean rating across all participants in the leaderboard
Biggest Movers
Each leaderboard tab shows the "Biggest Movers" - participants whose ratings have changed the most in the selected period. Controls include:
- Time Period: Select 7, 14, 28, 56, or 90 days
- Direction: Toggle between "In Form" (rising ratings) or "Out of Form" (falling ratings)
This helps identify rising stars with improving form, participants hitting a purple patch, or those experiencing a form dip.
Opening Profiles
Click any name in the leaderboard to open their detailed profile page with full statistics, charts, and analysis.
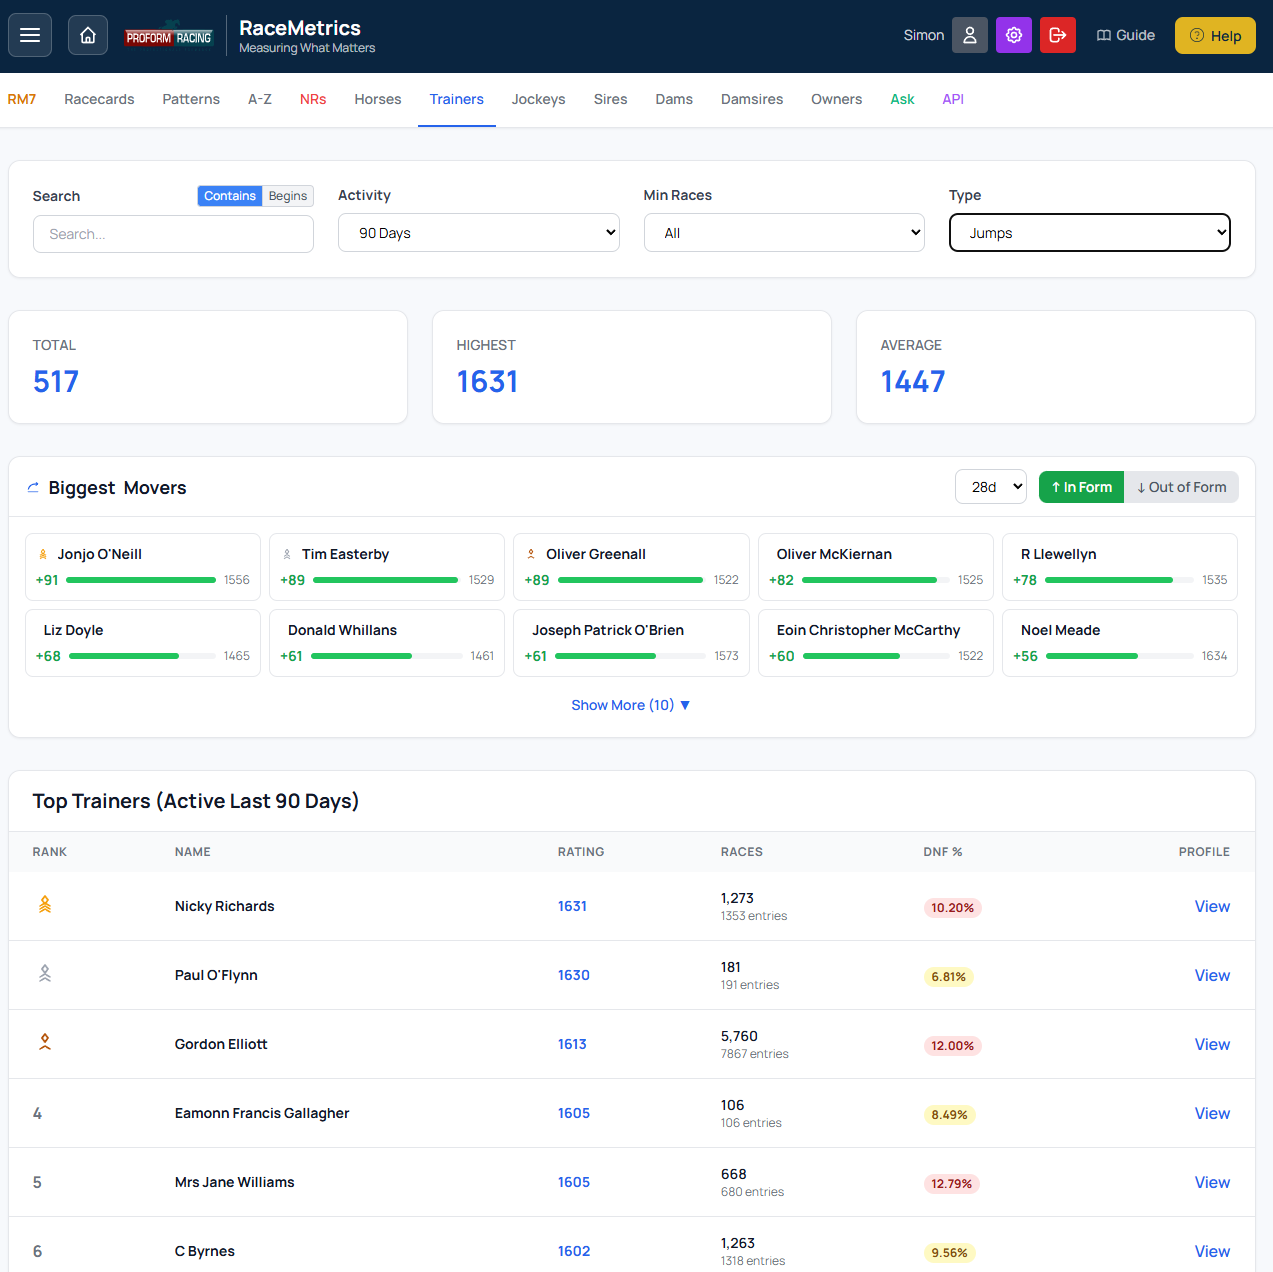
Dashboard showing leaderboard with filters, stats cards, and Biggest Movers section
RaceMetrics racecards provide enhanced race information with our unique ratings and analysis for every runner.
Accessing Racecards
- Racecards menu: Open the Racecards menu in the navigation bar and choose Racecards to see today's meetings
- Hamburger Menu: Click the menu icon (top-left) for quick access to all races
- Date Selection: Navigate between days using the date tabs
Dashboard Filter Pills
When an upcoming race date is selected, a small filter bar appears above the race grid. Use it to narrow the day's card without trawling every meeting. Pills within a group are mutually exclusive; the Clear filters button on the right resets everything.
- Handicap: All / Hcp only / Non-Hcp only
- Runners: All / <8 / 8-15 / 16+ (based on active runners, excluding non-runners)
- Class: All / 1-2 / 3-4 / 5-7
- Age: All / 2yo only / 3yo only / 3yo+ / 4yo+ — pure-age pills require an explicit upper limit; the + pills match races with no upper age cap
The filter bar is only available for upcoming races, not past results.
Race Tile Badges
Each tile in the grid shows the race time, class, prize, active-runner count, and HHI label, plus two extra at-a-glance markers:
- A small amber H badge next to the time indicates a handicap
- An age label next to the class/prize line shows the race's age range (e.g. 3yo+, 2yo, 3-5yo)
Navigating Between Races
Use the navigation arrows in the top-right corner of the screen to move between races. The display shows your current position (e.g., "27 of 28") and allows you to:
- Click the left/right arrows to move to the previous/next race
- Jump quickly through the day's races without returning to the menu
Race Header Information
The race header displays:
- Time & Course: Race time and venue
- Race Name: The full race title
- Distance, Type, Class, Going: Key race conditions
- Qual: Race qualifying conditions (age, sex, handicap rating limit). Sits between Class and MOR.
- MOR: Median Official Rating of all runners in the race (rounded to an integer; excludes non-runners and horses without an OR). Quick read on the field's class profile — a Class 5 handicap with an MOR of 65 is a typical low-grade affair, but one with an MOR of 73 is a strong field hugging the upper ceiling of the class. Sits between Qual and Going.
- Runners: Number of horses in the race
- Random: The win probability if you picked a horse at random (100% ÷ number of runners). Useful for comparing against actual Win % values
- HHI: The Herfindahl-Hirschman Index - a market concentration measure showing how predictable the race is based on betting odds. See below for details.
HHI - Race Predictability Index
The HHI (Herfindahl-Hirschman Index) is borrowed from economics where it measures market concentration. In racing, it shows how predictable the market thinks a race is based on the distribution of betting odds.
How It Works: The HHI is calculated by converting each runner's odds to an implied probability, normalising to remove the overround, then summing the squares of each probability. A race where one horse is heavily favoured will have a high HHI, while a competitive race with evenly-matched odds will have a low HHI.
Interpretation:
- Wide Open (< 0.15): Very competitive race, no clear favourite - good for finding value
- Competitive (0.15 - 0.25): Evenly matched field, moderate predictability
- Moderate (0.25 - 0.40): Market has clear preferences, some concentration
- Concentrated (0.40 - 0.60): Strong favourite in the field
- Dominant (> 0.60): Heavy favourite, very predictable - potential "banker" race
Price Priority: HHI uses morning prices where available, falling back to breakfast prices, then evening prices. The tooltip shows which price source was used.
Use Cases:
- Finding value: Low HHI races often have more betting value as the market is uncertain
- Banker selection: High HHI races can be used as "bankers" in accumulators
- Race selection: Filter by competitiveness to match your betting strategy
Dashboard Overview: The HHI label also appears on each race card on the dashboard, so you can quickly scan which races are competitive or dominated by a favourite without opening the full racecard. Hover over the label for a description.
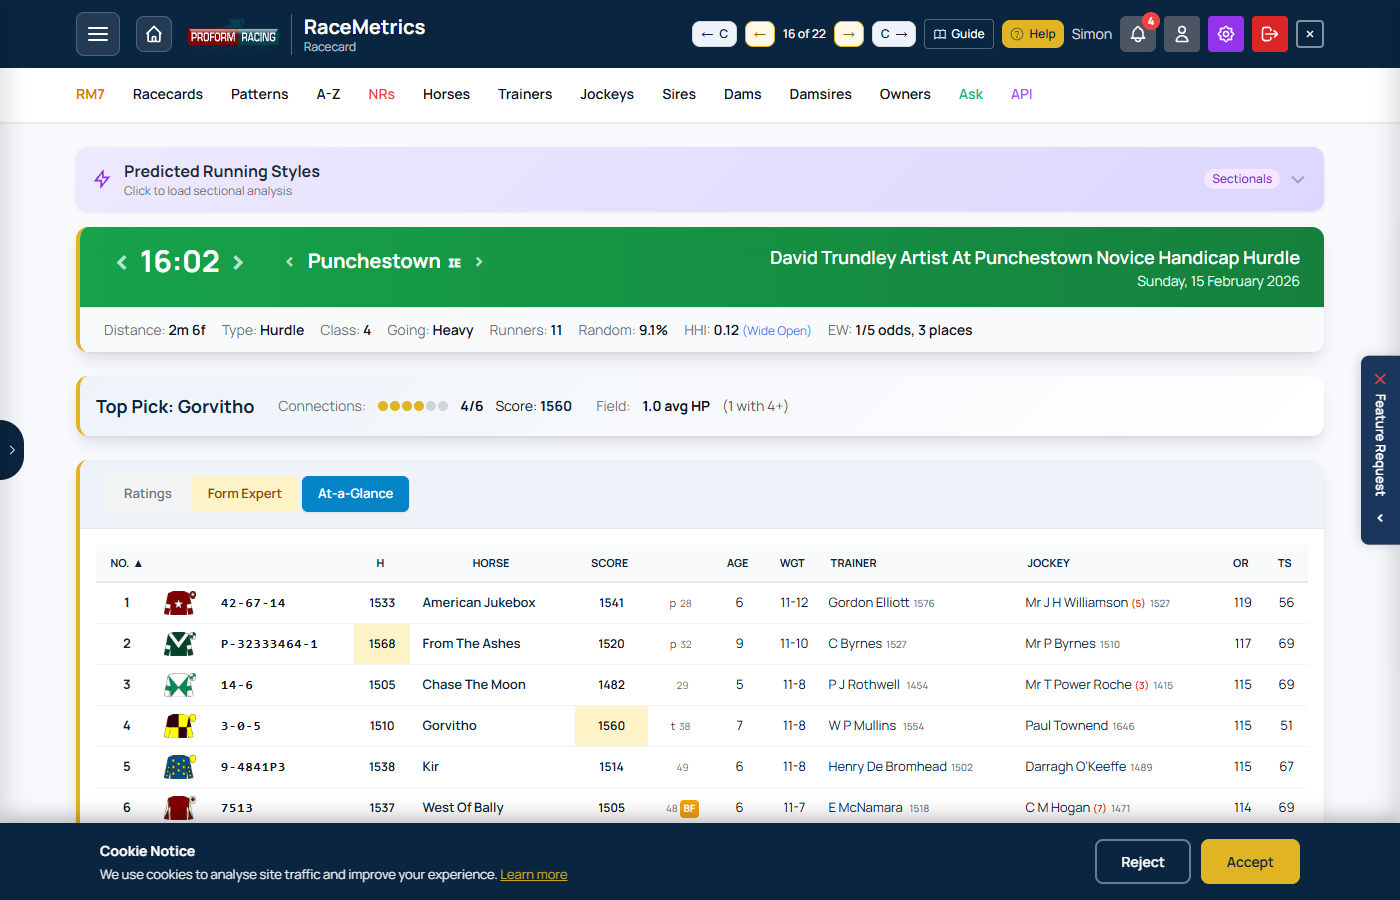
Top Pick
Shows the highest-rated runner with their connection strength and field quality summary.
Runner Columns Explained
- Rank: Position based on combined Score (1 = highest rated)
- # (Draw): Stall number
- DR: Draw position
- Horse: Horse name and age - click to open horse profile
- H: Horse's own rating (standalone form indicator, not included in Score)
- OR: Official BHA Rating for the horse (handicap mark). Shows "-" for horses without an official rating.
- HP: High Performer dots - filled dots indicate connections rated 1550+ (high performers)
- Score: Combined weighted rating from all 6 connections
- Win%: Estimated win probability based on Score relative to the field
- Place%: Estimated place probability using Harville approximation from Win%. Adjusts based on each-way terms (field size and handicap status). Shows "-" for 4 or fewer runners
- Excl: Exclude a runner from Win% and Place% calculations. Tick the checkbox to see adjusted probabilities without that horse. Useful for assessing chances if the favourite were removed
- EW (info bar): Current each-way terms for the race — shows paying places and odds fraction. Updates when runners are excluded
- Price columns (EVE, BKF, MORN): Evening, bookmaker, and morning prices
- Trainer, Jockey, Owner: Connection names - click any to open their profile
- O, S, D, DS: Individual ratings for Owner, Sire, Dam, and Damsire
Tip: You can show or hide Win%, Place%, and their probability bars individually in Account → Preferences.
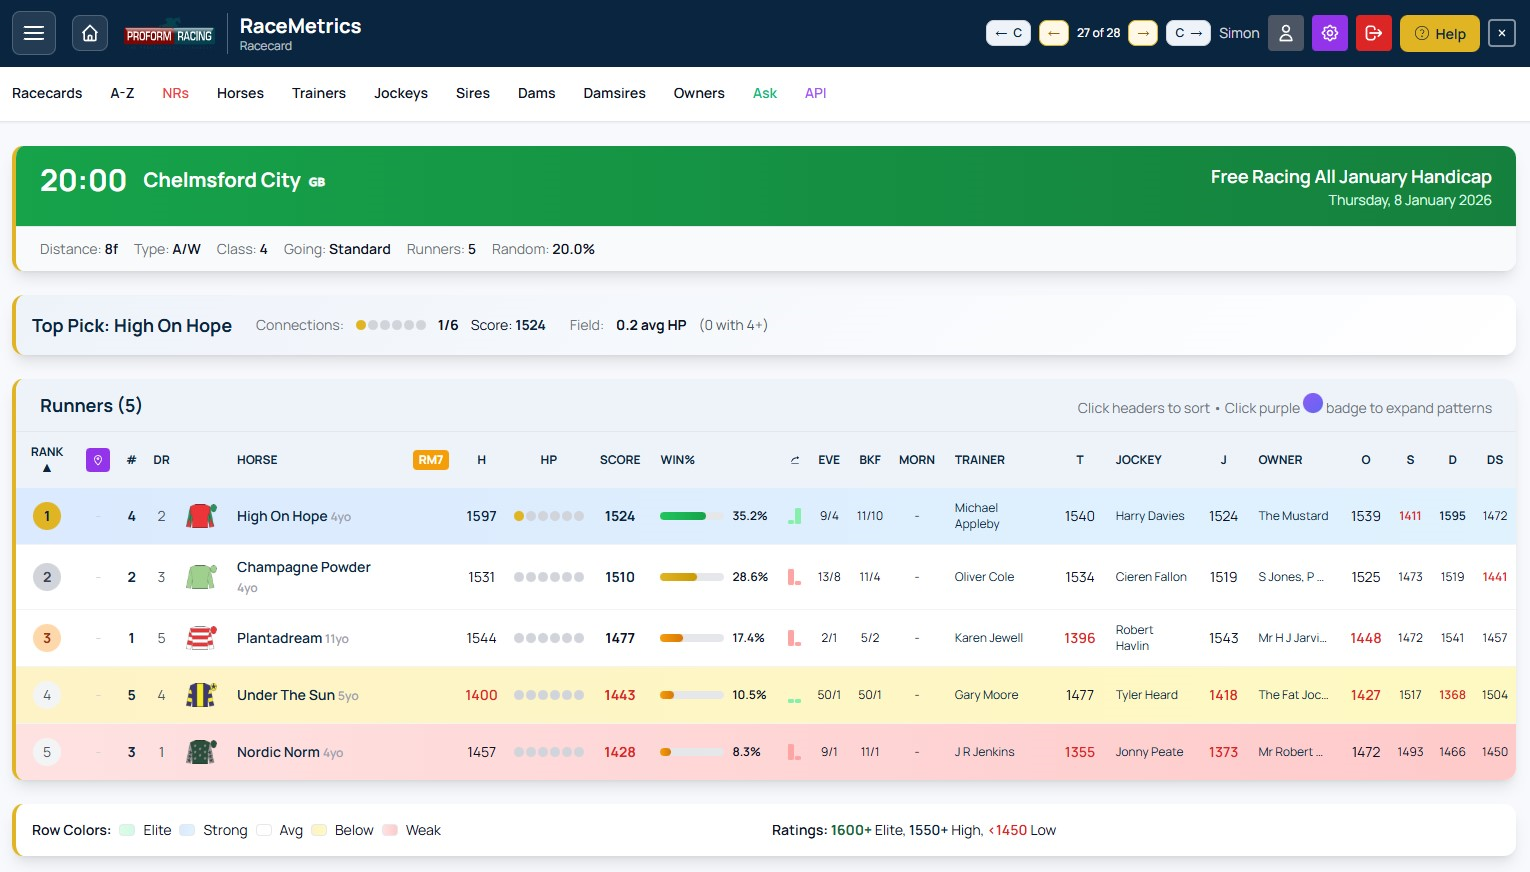
Example racecard showing runner ratings, HP dots, Win%, and pattern alerts
HP (High Performer) Dots
The HP column shows 6 dots representing the 6 connections (Owner, Trainer, Jockey, Dam, Sire, Damsire). A filled/coloured dot means that connection has a rating of 1550 or above (high performer status). More filled dots suggest stronger overall connections.
Row Colour Coding
Rows are colour-coded based on the runner's combined Score:
- Elite - Score 1600+ (green tint)
- Strong - Score 1550-1599 (blue tint)
- Avg - Score around 1500 (no tint)
- Below - Score 1450-1499 (amber tint)
- Weak - Score below 1450 (red tint)
Win % (Win Probability)
The Win % shows each runner's estimated chance of winning based on their combined Score compared to all other runners in the race. Higher-rated runners receive a higher probability. All Win % values in a race sum to 100%.
Combined Score Calculation
The Score column is a weighted average of 6 connection ratings:
- Owner: 20%
- Trainer: 20%
- Jockey: 20%
- Dam: 18%
- Sire: 12%
- Damsire: 10%
These weights reflect the predictive power of each connection based on historical data analysis.
Note: The Horse's own rating (H column) is displayed separately as a standalone form indicator and is not included in the combined Score calculation.
Clickable Links
Most names on the racecard are clickable links that open profile pages:
- Horse names → Horse profile
- Trainer names → Trainer profile
- Jockey names → Jockey profile
- Owner names → Owner profile
Pattern Alerts
If you've saved patterns in the Pattern Manager, matching runners will be highlighted on the racecard with purple pattern badges. Click a badge to expand and see the pattern details including historical stats and P/L.
Form Expert is an advanced form analysis tool that shows historical performance breakdowns for every runner in a race. Analyse form by going, class, course, age, distance, and field size across 7 different participant types.
Accessing Form Expert
- Open any racecard from the Racecards menu or the hamburger menu
- In the Runners section, click the Form Expert button to switch views
- Click Ratings to return to the standard racecard view
Participant Types
Use the participant dropdown to switch between 7 different analysis types:
- Horse: The horse's own historical form
- Trainer: How the trainer performs under various conditions
- Jockey: Jockey performance breakdown
- Sire: How the sire's offspring perform
- Dam: How the dam's offspring perform
- Damsire: Performance of the dam's sire's descendants
- Owner: Owner's runners performance breakdown
Control Bar Filters
The control bar at the top provides several filtering options:
- Race Type: Filter by All Types, Flat (Turf + A/W), Jumps (Chase + Hurdle + NHF), or specific surfaces
- Handicap: Filter by All, Handicap only, or Non-Handicap only
- Show Mode:
- Win - Shows win statistics only
- Win & Place - Shows win and placed (1st-4th) statistics
- PRB - Percentage of Rivals Beaten (average % of the field beaten)
- Period: Limit data to recent years (All, 5yr, 2yr, 1yr)
Match Race Button
The Match Race button is a powerful feature that:
- Sets all column filters to match the current race conditions
- Automatically adjusts Going, Class, Age, Distance, Field Size, Race Type and Handicap to match
- Stays active when navigating between races - ideal for quickly scanning a meeting
- When active, each new race automatically applies its own conditions
- Use the Reset button to turn off Match Race and clear all filters
Column Header Filters
Each category column (Going, Class, Age, Distance, Field) has from/to dropdown filters in the header:
- Going: Filter by ground firmness from Hard (firmest) to Heavy (softest). Order: Hard → Firm → Good To Firm → Good → Good To Soft → Soft → Heavy → Standard → Slow. A Surface dropdown below the going filters lets you narrow down to Turf, All A/W, Polytrack, or Tapeta specifically.
- Class: Filter by race class from 1 (highest, e.g., Group 1) to 7 (lowest)
- Course: Shows stats at the current course only (no filter needed)
- Age: Filter by horse age at race time — 2yo through 15yo individually, or 16yo+
- Distance: Filter by trip range. Flat uses 5f-6f, 6f-7f, 7f-1m, etc. Jumps uses 2m-2m2f, 2m2f-2m4f, etc.
- Field: Filter by field size - Small (1-7), Medium (8-11), Large (12-15), V.Large (16+)
When you change a column filter, a green Apply button appears next to that column - click it or the main Apply button to refresh the data.
Table Columns
- # - Card number (saddle cloth number)
- Silks - Jockey silks image
- Horse/Trainer/etc. - Participant name (click to view profile)
- Eve / Bkf / Morn - Best available price for the runner. The column heading updates dynamically as prices arrive through the day: Evening → Breakfast → Morning. Shows fractional odds by default (or decimal if set in preferences). Sortable.
- H - Horse's current RaceMetrics Rating (gold highlight = highest rated)
- Score - Form score based on filtered historical data (gold = highest)
- R - Total runs matching filters (hidden on mobile)
- W - Wins (or places/PRB depending on mode) (hidden on mobile)
- % - Strike rate percentage
Sorting
Click any sortable column header to sort the table:
- Default sort is by Score (descending)
- Sort order is remembered when navigating between races
- Sortable columns: #, Price, H, Score, and each category's R/W/% columns
Cell Colour Coding
Percentage cells are colour-coded based on strike rate:
- Green (33%+) - Excellent strike rate
- Amber (15-32%) - Moderate strike rate
- Red (<15%) - Low strike rate
- Grey - No data available
Filter Persistence
Form Expert remembers your preferences as you navigate:
- View preference: If you're on Form Expert and navigate to another race, you'll stay on Form Expert
- Filters carry forward: Your current filters apply to the next race you view
- Match Race persistence: When Match Race is active, it automatically applies each new race's conditions
- Sort order: Your column sort preference is remembered across races
- Reset button: Clears all filters and returns to defaults
Percentage Tooltips
Hover over any percentage cell to see the other two metrics without switching modes. For example, when viewing Win mode, hovering shows Win & Place % and PRB for that cell.
Legend
A colour legend appears below the table showing the percentage thresholds for green/amber/red cells.
Actual Going (Platinum)
Platinum subscribers can opt to use Actual Going instead of official/forecast going for historical form analysis in Form Expert.
- What's the difference? Official going is the forecast/declared going before or during a race. Actual going is recorded post-race and may differ.
- How to enable: Go to Account → Preferences → Platinum Features and turn on "Use Actual Going in Form Expert".
- When active: A gold Using Actual Going badge appears in the Form Expert control bar.
- Note: If actual going is not recorded for a historical race, it falls back to official going.
Race Conditions
Below the legend, the current race conditions are displayed showing Going, Class, Age, Distance, Field Size, Race Type and whether it's a Handicap - useful for reference when setting filters.
Mobile View
On smaller screens:
- R (runs) and W (wins) columns are hidden, showing only % for each category
- Table scrolls horizontally if needed
- Control buttons are sized appropriately for touch
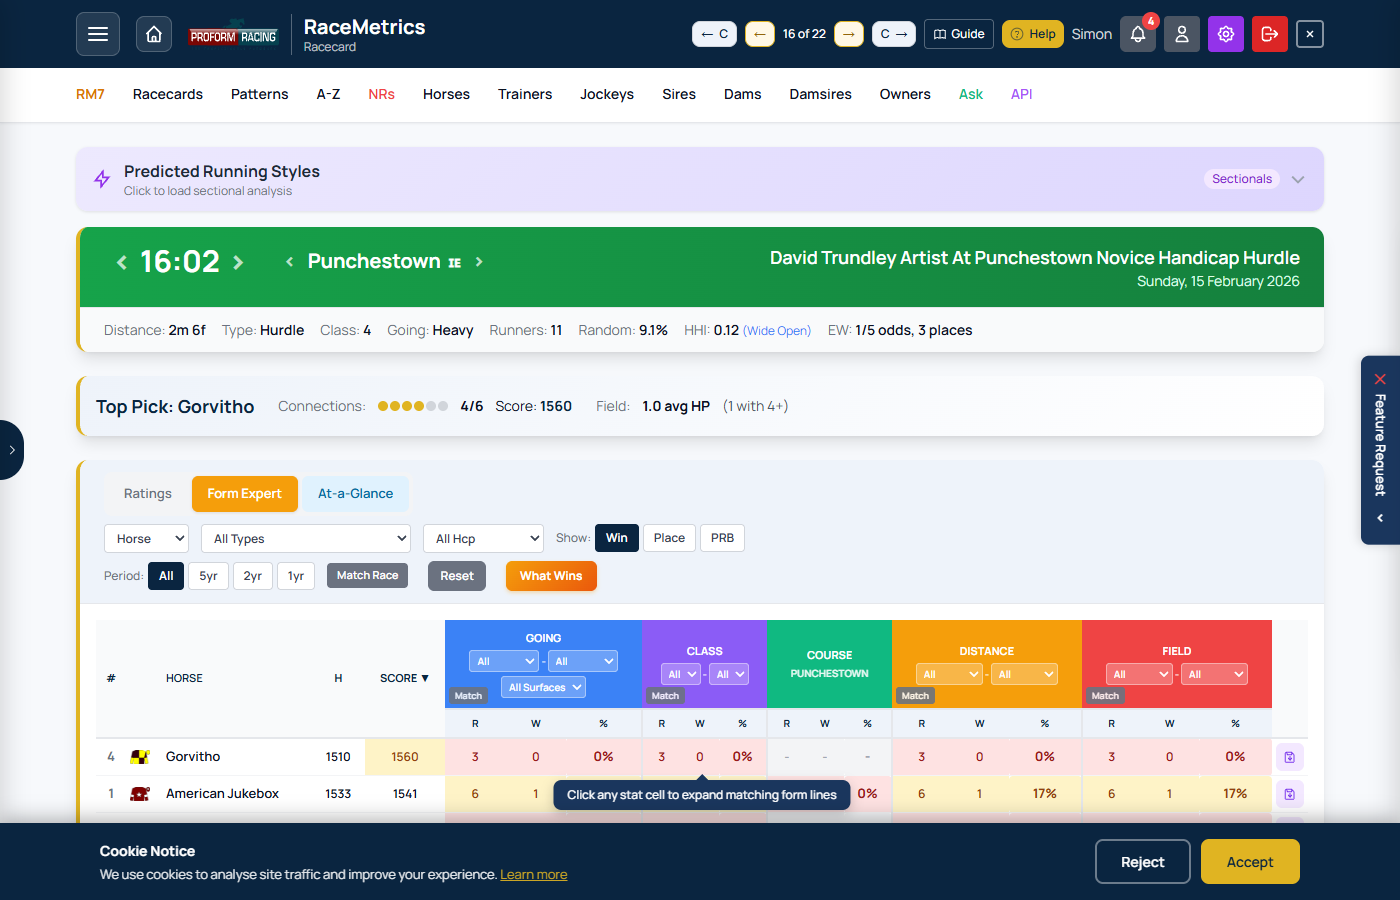
Form Expert view with control bar filters, participant type selector, and Going/Class/Course/Age/Distance/Field breakdowns for each runner
What Wins is a powerful pattern discovery tool that analyses historical performance to find profitable betting angles. It calculates the "Impact Value" (IV) for every participant + condition combination in a race, helping you identify edges that have historically outperformed expectations.
Accessing What Wins
- Open any racecard and switch to the Form Expert view
- Click the What Wins button in the control bar
- Available for Basic tier and above
Understanding Impact Value (IV)
IV measures how much a participant outperforms random chance when specific conditions are met. It's calculated as:
| IV Score | Interpretation |
|---|---|
| 1.0x | Average - wins at exactly the expected rate |
| 1.5x | Good - wins 50% more often than expected |
| 2.0x | Strong - wins twice as often as expected |
| 3.0x+ | Exceptional - significant historical edge |
Filter Conditions
What Wins analyses 11 different filter combinations for each participant type:
| Filter | Description |
|---|---|
| Going | Same going as today's race |
| Class | Same class level (1-7) |
| Course | At this course specifically |
| Distance | Similar trip range |
| Field Size | Similar number of runners |
| Going + Class | Both conditions combined |
| Going + Distance | Going and trip range |
| Class + Distance | Class and trip range |
| Course + Distance | C&D combination |
| Going + Class + Distance | Three-way combination |
| All Conditions | All five filters combined |
Participant Type Pills
Toggle which participant types to show using the filter pills at the top:
| Pill | Participant Type |
|---|---|
| HOR | Horse - the horse's own historical record |
| TRN | Trainer - the trainer's record with all horses |
| JKY | Jockey - the jockey's record with all mounts |
| SIRE | Sire - the sire's progeny record |
| DAM | Dam - the dam's offspring record |
| DS | Damsire - the maternal grandsire's record |
| OWN | Owner - the owner's record with all horses |
Minimum Runs Filter
Use the "Min" dropdown to set a minimum sample size. Higher thresholds give more reliable results but may hide emerging patterns. Options:
- Off - Show all results (may include small samples)
- 5 - At least 5 runs (recommended starting point)
- 10 - At least 10 runs (good balance)
- 20 - At least 20 runs (high confidence)
- 50 - At least 50 runs (very high confidence)
Reading the Results
Results are grouped by horse and sorted by best IV. Each row shows:
- Type Badge - Which participant type (HOR/TRN/JKY etc.)
- Filter - Which condition combination was applied
- Participant Name - The specific horse/trainer/jockey etc.
- IV Score - The impact value (e.g., 2.50x)
- Sample - Runs and wins (e.g., 15R/6W)
Using Results Effectively
- Look for high IV (2.0x+) with decent sample size (10+ runs)
- Multiple strong patterns on one horse suggests real edge
- Be cautious of very high IV with tiny samples (e.g., 8.00x from 2R/2W)
- Course + Distance patterns often most predictive
- Trainer patterns reveal stable strengths/conditions
Apply Pattern to Form Expert
Click on any pattern row to instantly apply those filters in Form Expert:
- Click any row - The modal closes and Form Expert loads with matching filters
- Participant type - Automatically switches to Horse/Trainer/Jockey etc.
- Filters applied - Going, Class, Course, Distance, Field Size set to match the pattern
- Quick comparison - See how all runners in the race perform under those same conditions
This lets you validate a promising pattern by viewing the full Form Expert breakdown for all runners, making it easy to spot if the pattern horse truly stands out.
Pin & Close
Click "Pin & Close" to keep the What Wins results visible while browsing the racecard. The pinned results stay as you navigate between races. Click "Close" to dismiss.
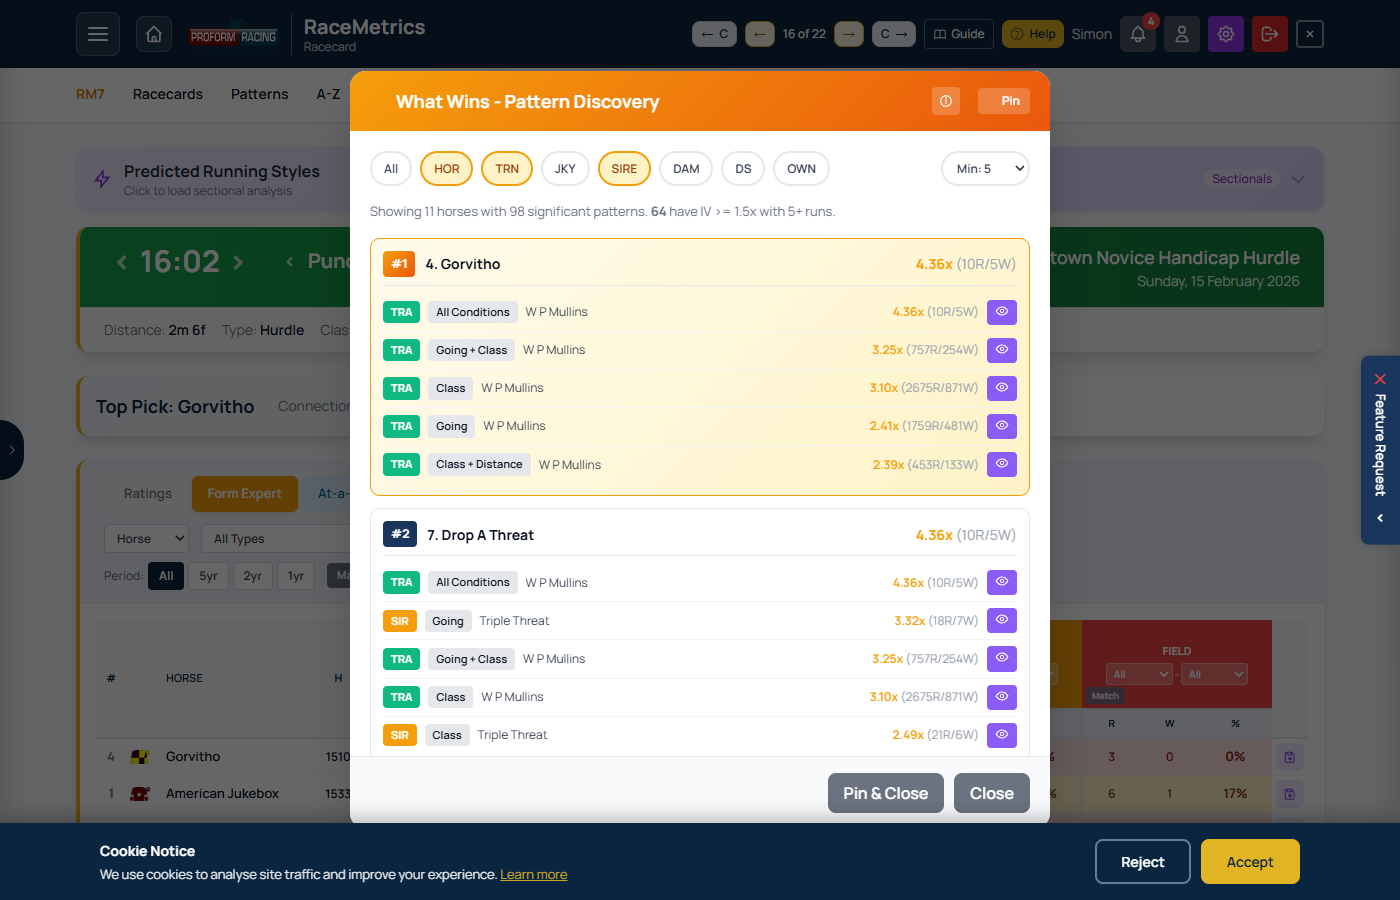
What Wins modal showing Impact Value analysis with participant + condition combinations ranked by performance
At-a-Glance is a compact Racing Post-style racecard view showing essential form data for quick reference and comparison.
Accessing At-a-Glance
- Open any racecard from the Racecards menu or the hamburger menu
- Click the At-a-Glance button to switch views
- Click Ratings or Form Expert to return to other views
Columns
| Column | Description |
|---|---|
| NO. | Racecard number (cloth number) |
| Silks | Jockey silks image |
| Form | Last 10 race positions. Numbers 1-9 show finishing position, 0 = 10th or worse. Letters: F=Fell, U=Unseated, P=Pulled Up, R=Refused, B=Brought Down, S=Slipped Up, C=Carried Out, D=Disqualified. Dashes (-) or slashes (/) indicate year breaks. |
| H | Horse's own RaceMetrics rating. Gold background = highest in race. |
| HORSE | Horse name (clickable to profile) |
| Eve / Bkf / Morn | Best available price. Column heading updates dynamically as prices arrive: Evening → Breakfast → Morning. Blank if no prices available yet. |
| SCORE | Combined RaceMetrics connection rating. Gold background = highest in race. |
| Info | Headgear (1 in bold = first time wearing), DSLR (days since last run), and history badges |
| AGE | Horse age in years |
| WGT | Weight carried in stones and pounds (e.g., 11-7) |
| TRAINER | Trainer name with RaceMetrics rating (clickable to profile) |
| JOCKEY | Jockey name with claim in brackets if applicable, plus RaceMetrics rating (clickable to profile) |
| OR | Official BHA Rating |
| TS | Highest Proform Speed Rating in the last year (Topspeed) |
History Badges
The Info column may display these badges indicating winning history:
- C Course winner - has won at this track
- D Distance winner - has won over this trip
- CD Course & Distance winner - has won at this track over this trip (takes priority over C and D)
- BF Beaten Favourite - has been beaten when favourite
Sorting
Click any column header to sort the table by that column. Click again to reverse the sort order. All columns with headings are sortable. Your sort preference is remembered between visits.
View Persistence
Like other views, At-a-Glance remembers your preference. If you navigate to another race while on At-a-Glance, you'll stay on that view.
Mobile View
On smaller screens, the table adjusts font sizes and can scroll horizontally. Touch-friendly throughout.
At-a-Glance view showing compact form strings, RaceMetrics ratings, horse details, trainer, jockey, and key stats
Inline Form Lines lets you instantly view a horse's recent race history without leaving the racecard. Available on all three racecard views: Ratings, At-a-Glance, and Form Expert.
Ratings & At-a-Glance: Click Any Horse Row
On the Ratings or At-a-Glance tabs, click any horse row to expand their last 6 form lines directly below. Click the same row again to collapse them.
- First 6 runs are shown by default for a quick overview
- Click "Show all X form lines" to reveal the full history
- Click the horse row again to close — works whether 6 or all lines are showing
- Opening a different horse automatically closes any previously expanded row
Form Expert: Click Stat Cells for Filtered Form
On the Form Expert tab, each column shows breakdown stats (Runs / Wins / Win%). Click any stat cell to expand the matching form lines for that category.
- Going column: Click a going stat (e.g. "5R 2W 40%") to see only the races run on that going range
- Class column: Click to see races in that class range
- Course column: Click to see races at that course
- Distance column: Click to see races at that distance range
- Field column: Click to see races with that field size range
The form lines shown are server-filtered to match exactly the criteria for that column, respecting any active filters (Going, Class, Distance, Field, Race Type, Handicap, Period).
A header above the form lines tells you the filter applied (e.g. "3 runs — Good To Soft to Heavy").
Colour-Coded Matching
Form lines highlight data that matches today's race conditions in green:
- Course name: Green if the horse ran at today's course
- Class: Green if the class matches today's race class
- Going: Green cell background if the going matches today's going
- Distance: Green cell background if the distance matches today's race distance
This lets you instantly spot relevant form — races run under similar conditions to today.
Form Line Columns
| Column | Description |
|---|---|
| Result icon | Click to view the full result for that race |
| Racecard icon | Click to view the historical racecard for that race |
| Trend icon | Click to see how that race has worked out — opens the Race Workout analysis showing what runners did in subsequent races |
| Date | Race date (hover for full race name) |
| Replay | ATR or RTV replay link if available |
| SR | Proform Speed Rating for that run |
| Pace | In-running position style (e.g. Led, Prominent, Held Up) |
| DR | Draw position |
| Race | Course abbreviation, class, conditions, and prize money |
| Dist | Race distance |
| Going | Official going description |
| Wgt | Weight carried (stones-pounds) |
| OR | Official BHA Rating at the time of race |
| MOR | Median OR of all runners in that race (rounded; excludes non-runners and horses without an OR). Read alongside the horse's own OR to see whether the horse was rated below, at, or above the field's class profile. Empty when none of the runners in the historic race had an OR. |
| Outcome | Finishing position, beaten distance, and winner details |
| ISP | Industry Starting Price |
| PRB | Percentage of Rivals Beaten (0-100 scale) |
| Jockey | Jockey name |
| Trainer | Trainer name |
Sectionals Toggle (Platinum)
If you have a Platinum subscription with the Sectionals Add On, a purple Sectionals pill button appears in the Race column header of the form lines table.
- Click Sectionals to switch the right-hand columns from standard data (Dist, Going, Wgt, OR) to sectional data
- Click again to switch back to the normal view
- Your preference is remembered across page refreshes and race navigation
When the Sectionals toggle is active, the following columns replace the standard ones:
| Column | Description |
|---|---|
| Race Pace | Colour-coded pace bar showing how each furlong section compared to par time. Green = faster, red = slower. Hover for full race details including conditions, result, jockey, trainer, and section-by-section breakdown |
| Style | Running style classification with icon (e.g. Led, Prominent, Mid-Division, Held Up) |
| Pos Track | Position at key race stages showing how the horse moved through the field |
| +/- | Net positions gained or lost from start to finish |
| Adj | Adjusted finishing position change based on sectional data — how many places the horse should have finished higher (positive) or lower (negative) had it run the race more efficiently |
| MaxU | Max upgrade in pounds from the last 4 furlongs — how many pounds the horse could have improved by running the section more efficiently. Click the column header to sort by MaxU (descending, then ascending, then back to date order) |
| FS 2f | Finishing Speed % difference vs par at 2 furlongs out. Hover for mph |
| FS 1f | Finishing Speed % difference vs par at 1 furlong out. Hover for mph |
| FS Fin | Finishing Speed % difference vs par at the finish. Hover for mph |
Sectional data is only available for races where sectional timing was recorded. If a past race has no sectional data, that row will show dashes in the sectional columns.
Click-to-Sort & Persistent Preference
Every column header in the form-line table is clickable. Each click cycles through three states — none → descending → ascending → none — with a small arrow showing the active sort. The sort uses the actual underlying value, not the displayed text:
- ISP: parsed to decimal odds-against (so “11/4 (2F)” becomes 2.75, “Evens” becomes 1.0, “4/5” becomes 0.8). Ascending puts the shortest prices first — favourites at the top.
- Wgt: parsed to total pounds (“10-7 t” becomes 147 lb), headgear suffix ignored.
- OffGng / ActGng: sorted by firmness rank (Hard → Firm → Good To Firm → Good → Good To Soft → Soft → Heavy, with the AW codes after). Ascending puts the firmest going first — not alphabetical.
- Date: sorted by race ID (monotonic with chronology).
- Outcome: sorted by finishing position; non-finishers sink to the bottom on ascending sort.
- SR · DR · OR · MOR · PRB · GA: direct numeric.
- Pace · Jockey · Trainer · Style: case-insensitive alphabetical.
Your last sort choice is saved in your browser and re-applied automatically — both on the racecard popup (Ratings / At-a-Glance / My Card / Handicap) and inside the profile breakdown drill-down popup. Reload, switch race, click into a different horse, or open a breakdown row — the sort comes with you.
Export to CSV Proform Premium
An Export CSV button sits at the top right of every form-line table. Premium members get a CSV file containing every column the table shows — plus race ID, race name, comment-in-running, and all sectional fields (when sectional data is present). UTF-8 encoded with a BOM so Excel opens it cleanly. CRLF line endings; commas inside fields are properly quoted.
On the racecard popup the button is gated to Proform Premium — non-Premium accounts see a locked button that triggers the upgrade prompt. Inside the profile breakdown drill-down the button is already unlocked because you needed Premium to open the popup in the first place.
Mobile View
On smaller screens, some columns (SR, Pace, DR, OR, ISP, Jockey, Trainer, Weight) are hidden to keep the essential information visible. The table scrolls horizontally if needed.
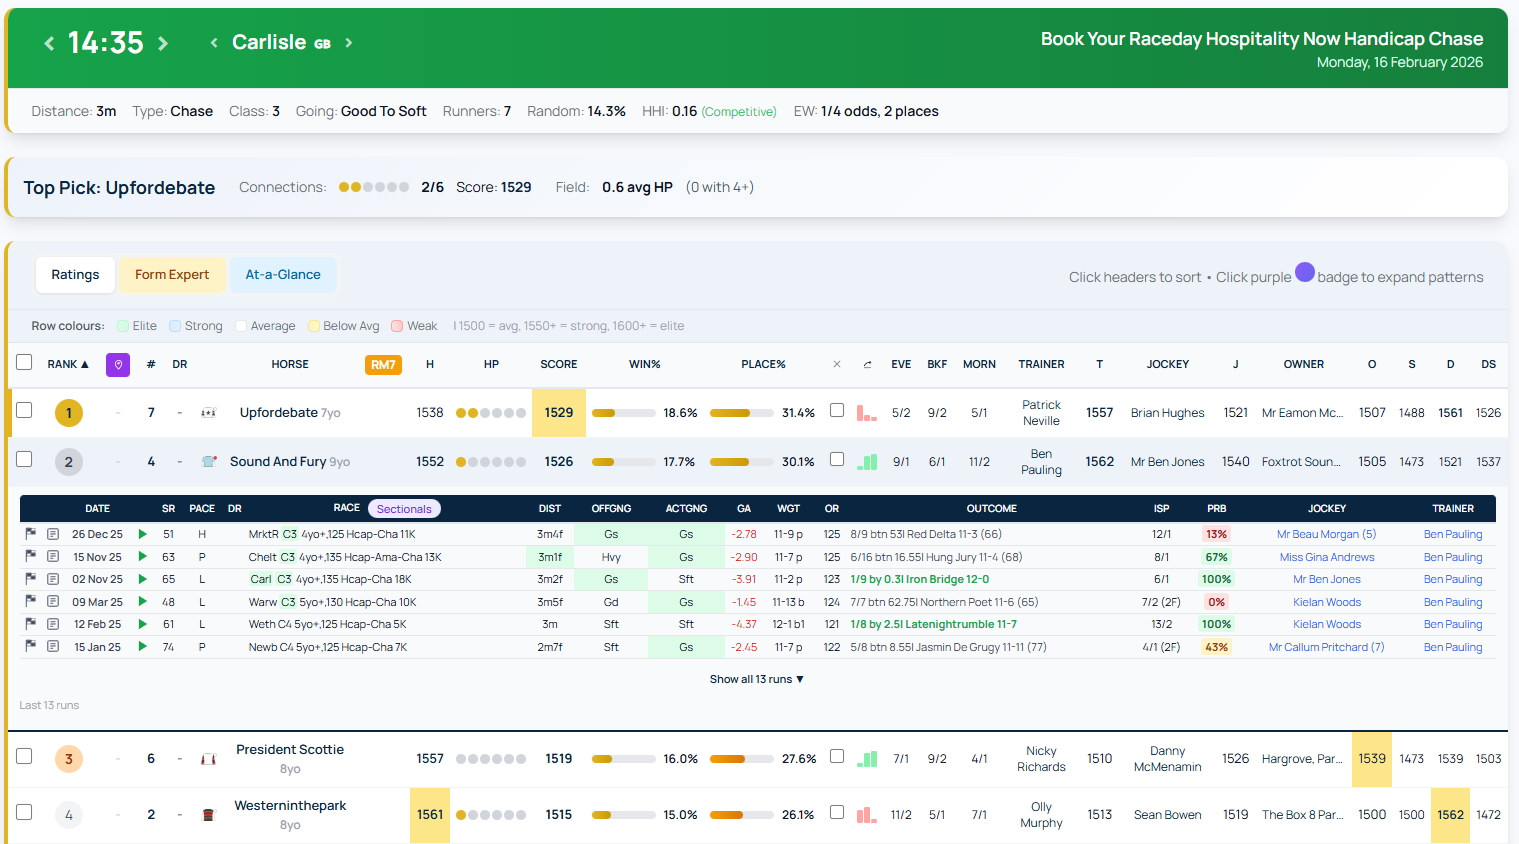
Inline form lines expanded below a horse row, showing recent race history with colour-coded course and distance matching
The Rating Comparison Chart lets you compare the rating history of multiple horses side-by-side on an interactive line chart. This is perfect for spotting improving or declining form trends across runners in a race.
Selecting Horses
- Use the checkboxes in the left column of the Ratings view to select horses
- Click the header checkbox to select or deselect all horses at once
- There is no limit to the number of horses you can compare
- 40 distinct colours are available for the lines
Chart Controls
- Last 10/20/50/All - Control how many races of history to display
- Rating / Score - Toggle between:
- Rating: Shows the horse's individual RaceMetrics rating history
- Score: Shows the weighted connection score history (see Score Mode below)
- Races Ago / By Date - Toggle between:
- Races Ago: Shows runs as relative positions (Latest, -1, -2, etc.) - good for comparing horses with different run frequencies
- By Date: Shows actual dates on x-axis - better for seeing timeline gaps
- Collapse/Expand - Click the chevron to collapse the chart panel
Score Mode
Score mode shows the weighted combination of all connection ratings at each historical run:
- Owner: 20%
- Trainer: 20%
- Jockey: 20%
- Dam: 18%
- Sire: 12%
- Damsire: 10%
The final point shows today's predictive score based on current connection ratings - useful for seeing how the support team compares to past runs.
Highlighting
- Click the eye icon next to a horse name to highlight that line
- Alternatively, click directly on a chart line to highlight it
- Click again or click empty space to clear the highlight
- When highlighted, other lines fade to make the selected horse's trend clearer
Chart Tooltip
Hover over any point on the chart to see detailed information:
- Date of the race (with days ago)
- Rating or Score after that race with the change (+/-)
- Course name, distance, and class
- Going conditions and race type (Flat/Hurdle/Chase etc.)
- Finishing position (e.g., 1st, 2nd, PU, etc.)
Legend Controls
- Click the coloured dot next to a horse name to temporarily hide/show that line
- Click the eye icon to highlight that horse's line
- Click the × button to remove a horse from comparison (unchecks the table checkbox)
- Click a horse name to open their profile page
Persistence
- Selections are saved per race - navigate away and return to see the same horses selected
- Settings (race limit, axis mode, chart mode) persist globally across all races
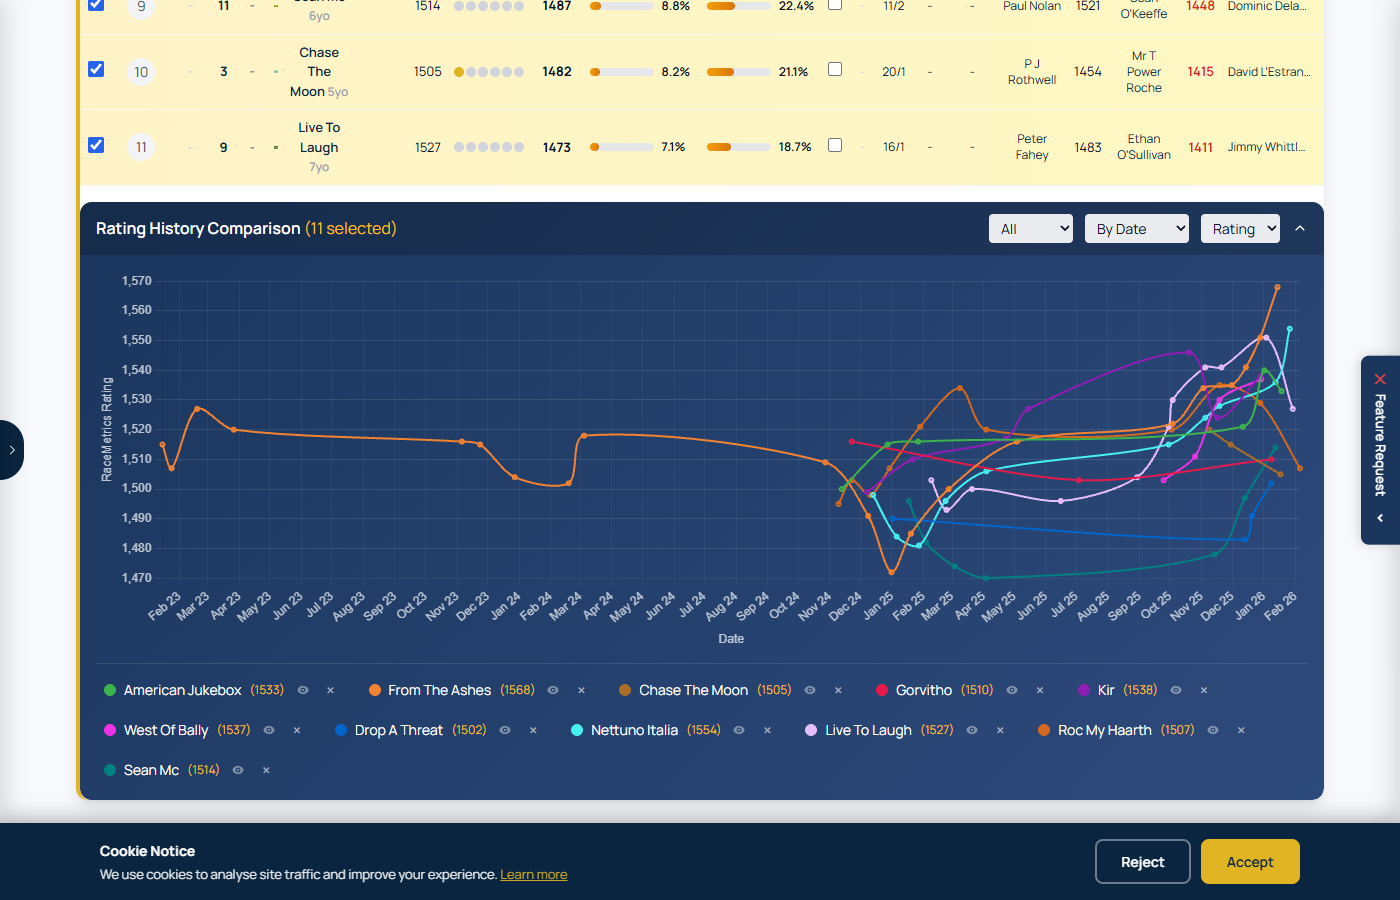
Rating Comparison Chart with multiple horses selected, showing rating trajectories over their last races
The Sectionals feature provides comprehensive race sectional data visualization, showing detailed timing, speed, and position data for each horse at every furlong marker throughout a race.
Access Requirements
- Requires Platinum subscription plus the Sectionals Add On
- Access from the racecard page via the "Sectionals" button (appears for races with available data)
Sectionals Tabs Overview
Sectionals includes 13 analysis tabs, each providing a different view of race performance:
1. Metrics Tab
A comprehensive overview combining upgrade analysis, acceleration times, speed, and stride data for each runner in one table. Green shading highlights the highest value in each column, red the lowest.
- Pos – Finishing position
- Dtw – Distance to winner (lengths)
- MaxU – Max upgrade from last 4f: how many pounds the horse could have improved by running the section more efficiently
- LbsAU – Pounds (lbs) behind winner after upgrade
- LenAU – Lengths behind winner after upgrade
- ChLen – Difference between actual lengths beaten and lengths after applying the upgrade
- PosAU – Theoretical finishing position after applying the upgrade
- ChPos – Difference between actual finishing position and theoretical finishing position
- TTR5–TTR30 – Time from out of the gate to reach 5, 10, 20, 25, and 30 mph (seconds)
- ROS – Late speed recorded 2 seconds after crossing the finishing line (mph)
- TS – Average top speed reached at any point in the race (mph)
- MINSL / ASL / MAXSL – Minimum, average, and maximum stride length (feet)
- MINSF / ASF / MAXSF – Minimum, average, and maximum stride frequency (strides per second)
All column headers are sortable – click to sort ascending, click again to reverse. Hover over any header for a description of the metric.
2. Times Tab
- Shows time (in seconds) for each furlong section
- Par times displayed in header row
- Supports speed unit conversion: Seconds, MPH, or KPH
- Color coding: Green = faster than par, Red = slower than par
- Interactive chart with each horse as a colored line
3. FSP% Tab (Finishing Speed Percentage)
- Shows each horse's speed from that section to the finish, as a percentage of its own average speed for the race — so 100% means that closing run matched the horse's own average (it is not the field average)
- Par for each section — the ground-adjusted benchmark for this race — is shown above each column, and it varies: typically near 100% early, then dropping into the high 90s by the finish as horses naturally slow
- Cells are colour-coded against that per-section par — green beats par, red falls short — so a horse can read below 100% yet still beat par at the line (a strong, sustained finish)
4. Position Tab
- Race position at each section (1st, 2nd, etc.)
- Lengths behind the leader displayed
- Cells color coded by time vs par (without showing time value)
- Chart with Y-axis inverted (1st at top)
5. Time Diff Tab
- Difference between horse's sectional time and par time
- Positive values = slower than par, Negative = faster
- Total column shows cumulative deviation
6. FSP% Diff Tab
- Difference between horse's FSP and par FSP
- Positive values = faster than par, Negative = slower
- Average column shows mean deviation
7. Cumulative Tab
- Running total of sectional times at each point
- Useful for comparing overall race time progression
8. Heat Map Tab
- Visual grid with color gradient showing performance intensity
- Green (fast) through yellow to red (slow)
- Click column headers to highlight that section across all tabs
9. Stride Tab
- ASL (Average Stride Length) in meters
- ASF (Average Stride Frequency) in strides/second
- Scatter plot: ASL (x-axis) vs ASF (y-axis)
- Field averages displayed below grid
10. Top Speed Tab
- Maximum speed achieved by each horse in mph
- Horses sorted by top speed (fastest first)
- Visual speed bars with rank highlighting (gold, silver, bronze)
11. FSP% Efficiency Tab
- FSP Efficiency Rank at each section
- Shows how efficiently each horse converted effort to speed
- Rank 1 = best efficiency at that section
- Color coded by rank (gold for 1st, green for top ranks)
12. Upgrades Tab
- Upgrade indicators at each section
- Flags potential rating improvements
- Total column shows count of upgrades across sections
13. Running Style Tab
Classification of racing style based on positional data:
- Held Up: Stays back most of race
- Mid-Division: Middle of the field
- Closer: Starts back, finishes strong
- Stalker: Mid-pack early, improves late
- Prominent: Near front but not leading
- Front Runner: Starts and stays near front
Includes position movement table showing Start/Mid/Finish positions with Gained/Lost column.
Controls
- Show Filter: All Runners, Top 3, Top 5, or Top 6 finishers
- Hide 1st Section: Excludes first section from charts (often skewed by starting stall behavior)
- Compare Mode: Select specific horses to compare directly
- Speed Unit: Toggle between Seconds, MPH, or KPH
Horse Color Dots
All tabs include colored dots next to horse names that match the chart line colors, making it easy to identify each horse's data in both the grid and chart views.
Section Highlighting
Click on any column header to highlight that section across all tabs, making it easy to compare performance at specific points in the race.
Predicted Running Styles (Racecards)
Available on the Racecard page (not race results), this feature predicts how each horse is likely to run based on their historical sectional position data. Found in the purple "Predicted Running Styles" accordion near the top of the racecard.
How It Works
- Analyzes up to the last 10 races with sectional data for each horse
- Uses decay weighting - recent runs carry more weight than older ones
- Calculates average positions in early and late stages of races
- Blends in the horse's Gate Speed Score – a 0–100 percentile of how fast it breaks from the stalls (measured times to reach 10mph over its last 5 tracked runs). Fast-gate horses lead early about twice as often, so measured gate speed sharpens the early-position evidence
- Classifies each horse into a predicted running style
Running Style Categories
- Front Runner: Typically leads from the start, racing in positions 1-3 early
- Prominent: Races near the front but not leading, positions 2-4
- Stalker: Tracks in mid-pack early, then moves up in the closing stages
- Mid-Division: Races in the middle of the field throughout
- Closer: Starts towards the back, finishes strongly, improving position late
- Held Up: Held at the back of the field, makes a late run
Table Columns Explained
- Style: The predicted running style with color-coded icon
- Gate: Gate Speed Score (0–100 percentile of stalls-break speed; red ≥ 80, amber ≥ 60; "–" when fewer than 2 measured runs)
- Runs: Number of historical races with sectional data used for the prediction
- Early Pos: Weighted average position in the first half of races (lower = closer to front)
- Late Pos: Weighted average position in the second half of races
Confidence Indicators
- 3+ runs: Normal confidence - reliable prediction
- 1-2 runs (⚠): Low confidence - treat with caution, shown with warning icon
- 0 runs: Insufficient data - no prediction available
Distance DNA & Full of Running
- Distance DNA: shown as a card on each horse's profile and as a colour-coded column in the racecard's Sectional Profile tab, comparing a horse's stride cadence to winning horses at the trips it has been running. Winners' cadence falls steadily as trips lengthen (≈2.39 strides/sec at 5–6f down to 2.15 at 2m+), so a horse galloping markedly slower than the winners at its trips profiles as built for further; quicker suggests sharper trips. Needs 3+ measured stride runs.
- Full of Running ("FoR LTO" badge): a beaten horse that recorded a top-2 run-out speed (measured 2 seconds after the line) and finished faster than par crossed the line with plenty left. These win about 16% next start vs a 10% baseline. The badge shows on racecard runner rows (and a chip on the profile) until the horse runs again, and a notification lists flagged horses on the morning they're declared.
- Both are part of the Sectionals toolset (Proform Premium + Sectionals Add-On).
What to Look For
- Pace Scenario: Multiple Front Runners suggest a fast early pace, which may favour Closers and Held Up horses
- Lack of Pace: No Front Runners may result in a slow pace, favouring those who race prominently
- Track Bias: Some courses favour front-runners (e.g., tight tracks), others suit closers (e.g., stiff finishes)
- Early vs Late Pos: Compare these values - horses improving late (lower Late Pos than Early Pos) may have more to give
- Lone Front Runner: A single Front Runner with no pace pressure often has an advantage
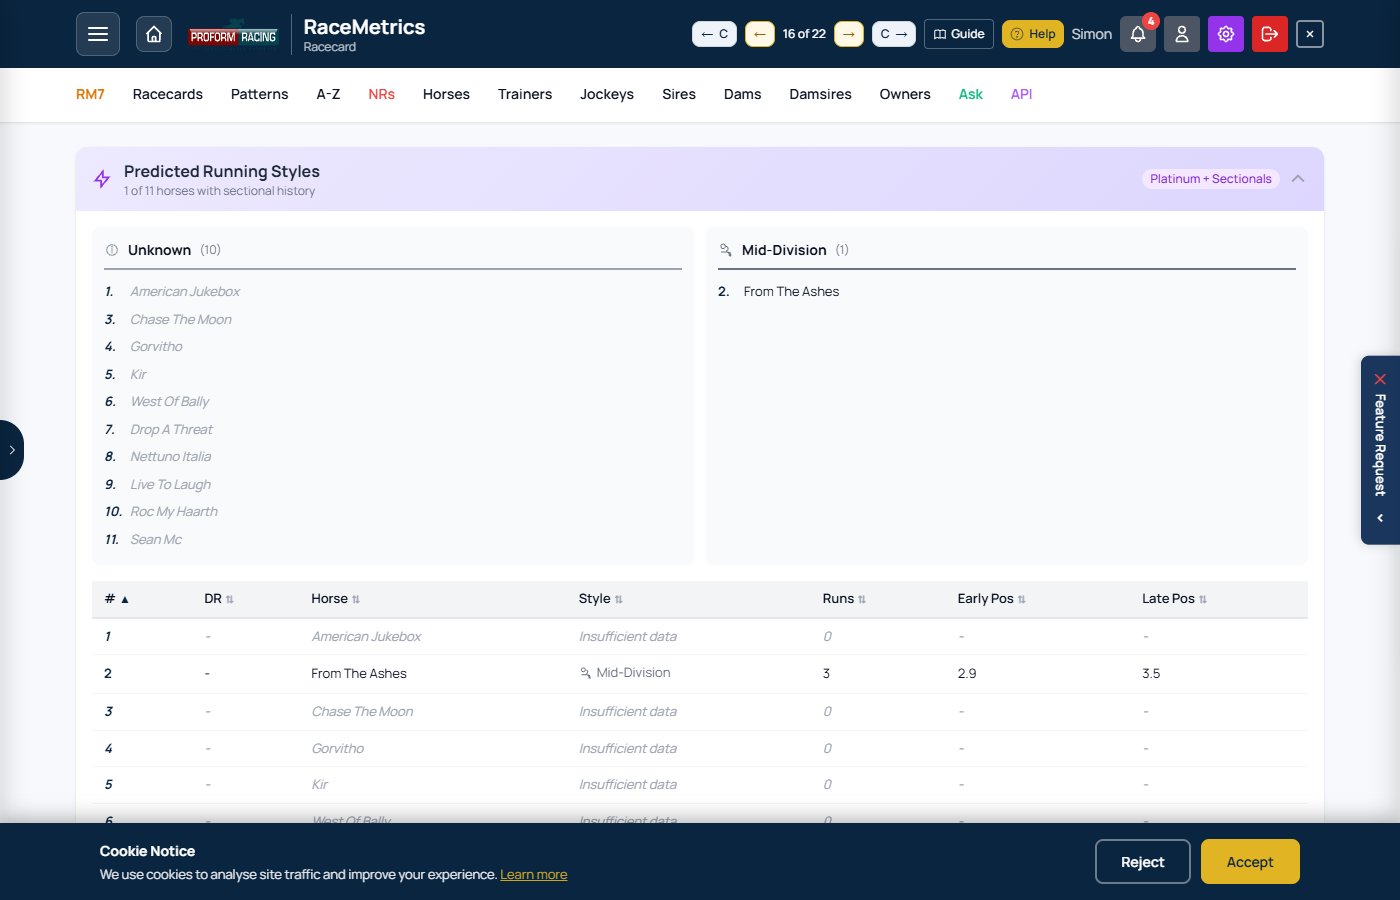
Predicted Running Styles panel showing pace predictions, early/late positions, and running style classifications for each runner
The A-Z Runners page shows all declared runners for the selected day, sorted by Score by default. This gives you a complete overview of the day's racing with full RaceMetrics analysis.
Filters & Controls
- Date Dropdown: Select which day's runners to view
- 3+ High Performers: Toggle to show only runners with 3+ High Performer connections
- Search: Filter by horse name
Ranking & Price Filters
A second filter bar lets you narrow runners by in-race ranking or price movement:
- H Rank: Show only runners ranked Top 1, Top 2, or Top 3 by Horse rating (H) within their race. "All" shows every runner.
- Score Rank: Show only runners ranked Top 1, Top 2, or Top 3 by combined Score within their race. "All" shows every runner.
- Price Drop: Filter by price shortening between price stages:
- Bkf < Eve — Breakfast price shorter than Evening price
- Morn < Eve — Morning price shorter than Evening price
- Morn < Bkf — Morning price shorter than Breakfast price
- Any Drop — Any price shortening across any stage
Active filters show a count of matching runners and a Reset button to clear all rank/price filters.
Stats Summary
Six cards at the top provide a day overview:
- Runners: Total runners for the day
- Avg: Average combined Score
- Top: Highest Score of the day
- Elite: Runners with 3+ High Performer connections
- Races: Number of races
- RM7: Runners matching your RM7 competition selections
Pattern Matches Banner
When runners match your saved patterns, a purple banner appears showing the count and listing matched horses. Use the buttons to:
- Show All: Expand all pattern details inline
- Hide All: Collapse all pattern details
- Manage: Go to Pattern Manager
Table Columns
- Date/Time: Race date and off time - click to open racecard
- Course: Venue name
- Rnrs: Number of runners in that race
- Horse: Horse name - click to open profile
- RM7: Highlights if horse matches your RM7 selection
- Score: Combined weighted rating from all 6 connections
- Price Chart: Mini chart showing price movement (green = shortening, red = drifting)
- Eve/Bkf/Morn: Evening (8:30pm), Breakfast (7:30am), and Morning (10:30am) prices
- x Random: How many times better than random chance (e.g., 3.5x means 3.5× more likely to win than random)
- Win %: Estimated probability of winning based on Score relative to all runners in the same race
- HP: High Performer dots - filled dots show connections rated 1550+
- H: Horse's own rating (separate from the combined Score)
- T/J/S/D/DS/O: Individual ratings for Trainer, Jockey, Sire, Dam, Damsire, Owner
- Patterns: Purple badges show saved patterns matching this runner
Score Colour Coding
Rows are coloured based on combined Score:
- Elite - Score 1600+ (green)
- Strong - Score 1550-1599 (blue)
- Average - Score around 1500 (white)
- Below - Score 1450-1499 (amber)
- Weak - Score below 1450 (red)
Sorting
Click any column header to sort. Default is by Score (highest first). Click again to reverse sort order.
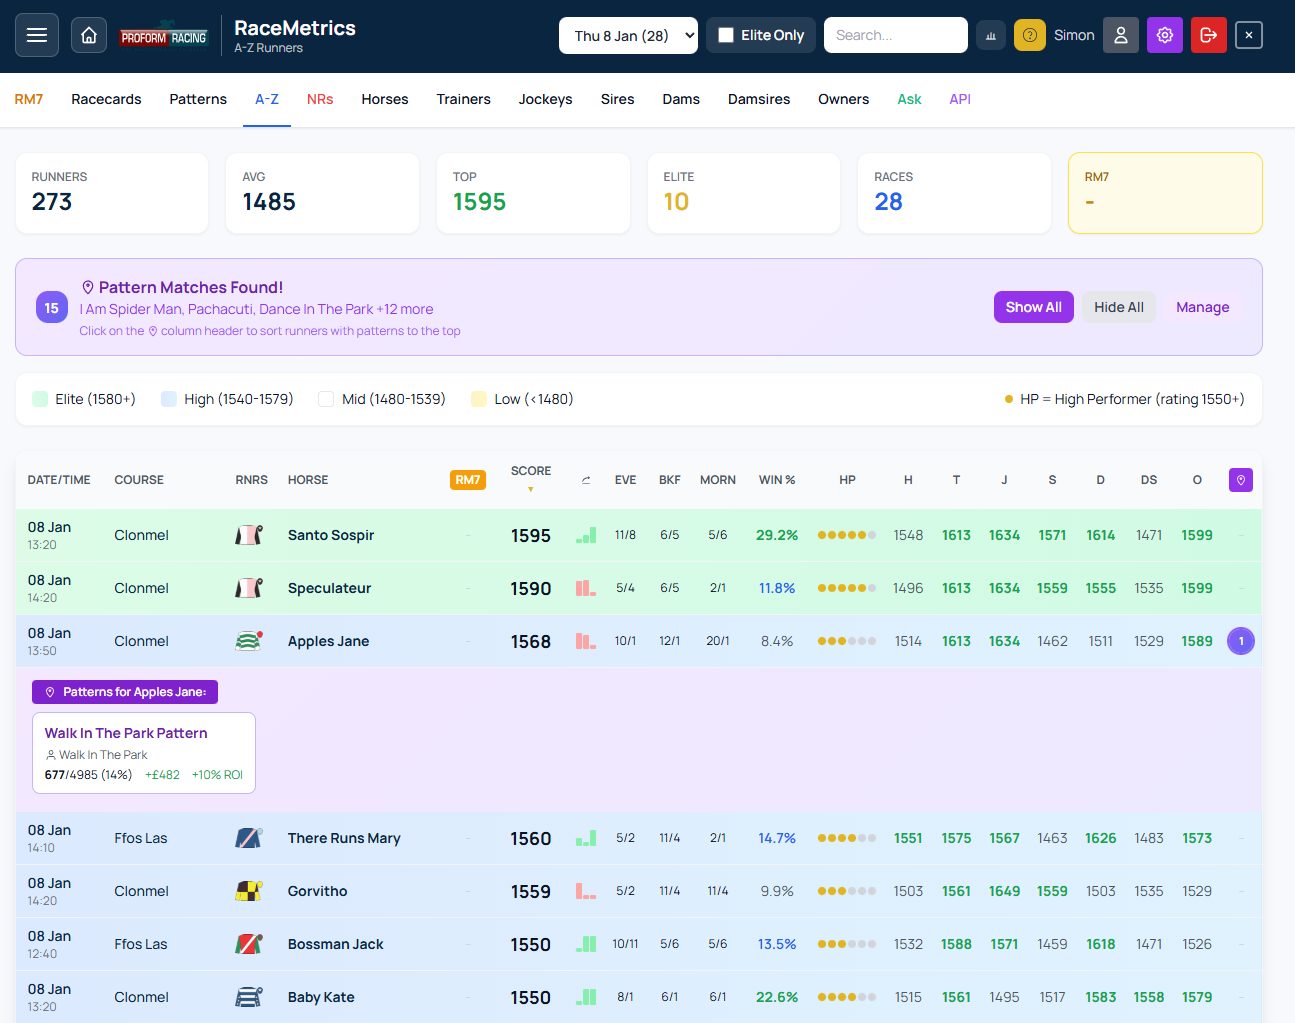
A-Z Runners page showing stats summary, score colour coding, and full runner details
Subscription Note
The A-Z Runners page requires a Basic subscription or higher. Free accounts do not have access to this feature.
Profile pages provide comprehensive statistics and analysis for any participant. Access profiles by clicking names anywhere in the app.
Profile Header
Coloured stat cards at the top show key metrics:
- Rating: Current RaceMetrics rating (1500 average, 1550+ high, 1600+ elite)
- Runs: Total career runs
- Win %: Overall win strike rate
- P/L: Profit/loss to £1 level stakes at BSP
- Entries: Current upcoming entries (if any)
Loading Large Profiles
For sires and other profiles with thousands of runs, the page loads in two stages:
- Quick Load: First 500 records load within seconds
- Background Load: Remaining history loads automatically
Stats update automatically when all data finishes loading.
Overview Tab
The main tab showing summary statistics, performance chart, and quick breakdowns.
Performance Summary shows: Wins, Places, Runs, Win Rate, Place Rate, Avg Field Size, and IV (Win) - the Impact Value showing how often this participant wins relative to expected.
P/L to £1 Stakes shows: Win P/L, ROI percentage, and Average Win BSP.
Chart - Use the dropdown to switch between:
- Rating History: Performance rating over time with overall average (dotted white) and moving average (dashed orange) lines to spot form trends
- P/L: Rolling profit/loss to £1 stakes at BSP with overall average line
- Win Rate: Rolling win percentage with overall win rate reference line
- PRB: Percentage of rivals beaten with 50% baseline (average performance) and overall PRB average lines
Dynamic Windows: Rolling calculations automatically adjust based on total runs - shorter windows for fewer runs, longer for more data. This ensures smooth trend lines regardless of sample size.
The chart automatically switches to P/L view when filters are active.
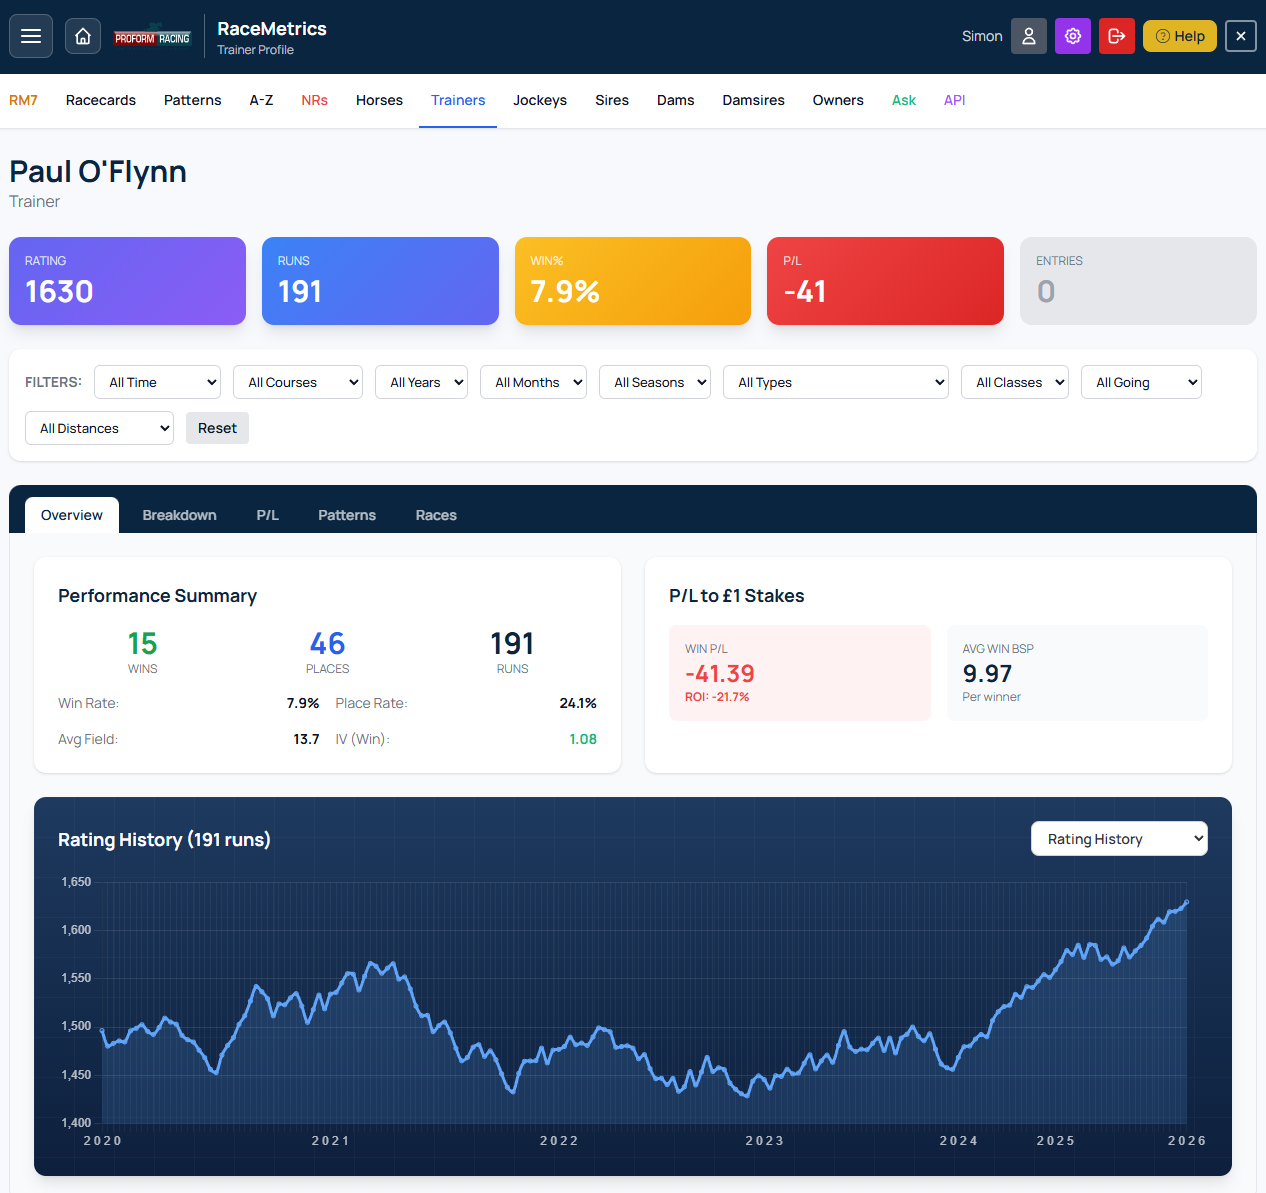
Profile page showing header stats, performance chart, and breakdown tables
Breakdown Tab
Detailed performance splits showing statistics across multiple categories. Each breakdown table shows:
- Name: The category value (horse name, course, class, etc.)
- Runs: Number of runs in that category
- Wins: Number of wins
- Win%: Strike rate percentage
- PRB: Percentage of rivals beaten average
- P/L: Profit/loss to £1 stakes at BSP
- ROI: Return on investment percentage
Available breakdowns:
- By Horse/Jockey/Owner: Performance with specific connections
- By Course: Track-by-track statistics
- By Class: Performance at each race class (1-6)
- By Race Type: Turf, Chase, Hurdle, NHF splits
- By Days Since Last Run: Freshness analysis
- By Distance: Performance over different trips
- By Favourite Status: When favourite vs outsider
Use Min Runs dropdown to filter out small samples. Click Show All to expand each table. Click any row to open the form-line drill-down (see below).
Form-Line Drill-down Proform Premium
Two entry points on every profile open the same popup — the full inline form lines for whichever subset of runs you've drilled into. Same rich form-line view used on the racecard popup: SR, Pace, DR, Race, Dist, OffGng, Wgt, OR, MOR, Outcome, ISP, PRB, Jockey, Trainer. On non-horse profiles (trainer, jockey, owner, sire, dam, damsire) an extra Horse column sits before Date so you can tell which run was which — each name links to that horse's profile. Premium members on a sectionals plan also get the Sectionals toggle (Race Pace bar, Style, Pos Track, +/-, Adj, MaxU, FS 2f / 1f / Fin).
- Click the blue RUNS card at the top of the profile — the popup shows the latest 100 runs in the participant's full history (or in the currently-filtered subset if you've narrowed the page with the filters above).
- Click any breakdown row — the popup shows the runs that built that statistic. For example, a horse profile's “By Jockey: Ryan Moore” row shows every run this horse has had under Ryan Moore.
Both entry points use the same Click-to-Sort, persisted-sort, and Export-CSV behaviour described under Inline form lines — so whatever sort you've picked on the racecard popup is already in place when the drill-down opens, and the Export CSV button is unlocked because you needed Premium to get into the popup in the first place.
Large breakdowns are capped at the most recent 100 runs for performance — the popup header tells you when that cap has kicked in (e.g. “5,879 runs · 1,492 wins · PRB 64.4% · showing latest 100”). The cap keeps a typical Mullins-sized trainer drill-down rendering in well under a second; if you need more runs, narrow the page filters first and re-open.
The drill-down is gated to Proform Premium. Non-Premium accounts get an upgrade prompt instead of the popup — no fetch is made.
P/L Tab
Profit/Loss tracking based on £1 level stakes to Betfair SP. Shows cumulative P/L chart and breakdown by price range.
Patterns Tab
AI-detected profitable angles based on the current participant's history. The system automatically identifies:
Profitable Angles (green cards):
- Best Course: Most profitable track
- Best Season: Spring, Summer, Autumn, or Winter
- Best Class: Most successful race class
- Best Going: Preferred ground conditions
- Best Day: Day of week with best results
- Best Age: Age range (for horses via connections)
- Best DSLR: Optimal days since last run
- Best Price: Favourite, 2nd Fav, or Outsider
- Hot Jockey: Currently in-form jockey pairing
- When Favourite: Performance when market leader
Patterns to Avoid (red cards): Conditions showing negative ROI - courses, going, etc. where this participant struggles.
Click Quick Save or Save to Avoid to add patterns to your Pattern Manager for racecard alerts.
Races Tab
Complete race-by-race history. Shows 100 races at a time with Load More to fetch additional records.
Columns:
- Date: Race date
- Course: Track name
- Field: Number of runners
- Runners: Position and horse name (e.g., "1st Precious Man")
- Rating: RaceMetrics rating after this race
- Change: Rating points gained (green) or lost (red)
Click any row to open the full race result showing all runners with rating changes.
Race Results Popup
When you click a race from the Races tab, a detailed results view opens showing:
- Race header: Time, course, race name, distance, type, class, going, runners
- Full results table: All runners with finishing positions
- Rating changes: For each connection (H, T, J, S, D, DS, O) showing gains in green and losses in red
- Sectional Analysis: (Platinum + Sectionals Add On) Expandable section with full sectional data
Click any horse, trainer, jockey, or owner name to open their profile.
Filters
Apply filters to narrow down to specific conditions. Filters update all tabs and charts dynamically. Available filters:
- Time: All Time, Last 365 days, Last 180 days, etc.
- Courses: Filter to specific course(s)
- Years: Individual year selection
- Months: Specific month(s)
- Seasons: Spring, Summer, Autumn, Winter
- Types: Race type (Flat, NH Flat, Hurdle, Chase)
- Classes: Race class (1-7)
- Going: Ground conditions
- Distances: Distance range
Click Reset to clear all filters.
Saving Patterns
When you find a profitable angle, click "Save Current View as Pattern" to track it. Saved patterns appear as purple badge alerts on racecards when conditions match.
Recent Profiles Panel
Click the tab on the left side of the screen to open a slide-out panel showing your recently viewed profiles for quick navigation.
Colour coding by type:
- Horse - Blue
- Trainer - Green
- Jockey - Red
- Sire - Purple
- Dam - Cyan
- Owner - Orange
Closing the panel: Click the X button in the top corner, or simply click anywhere else in the app.
The Race Results page shows detailed results for completed races, including finishing positions and rating changes for all participants.
Accessing Race Results
- From Dashboard: On the dashboard's Racecards view, look for the teal date pills on the right side showing the last 5 days of results
- Calendar Picker: Click the calendar button to select any date back to January 2018
- From Profile Pages: Click any race row in the "Races" tab to view full results
- From Racecards: After a race has run, click the race to see results
Dashboard Results View
When viewing results from the dashboard:
- Teal date pills: The right side of the date bar shows the last 5 days with results available
- Race cards: Each card shows the race time, class, prize money, and the winner's name and SP
- Favourite indicator: An "F" appears next to the SP if the winner was the favourite
- Click any card: Opens the full race results page with detailed finishing positions and Elo changes
Browsing Results from Results Page
When viewing a race result, use the hamburger menu (☰) to navigate to other results:
- Click the date header: Opens a calendar to pick any date with results
- Course sections: Shows all courses that raced on that date
- Time pills: Click any race time to jump to that result
- Current race: Highlighted in teal so you know where you are
Race Header
The amber header displays key race information:
- Time & Course: Race off-time and venue
- Race Name: Full race title
- Date: Day and date the race was run
Below the header, a grey bar shows: Distance, Type (Flat/NH), Class, Going, and number of Runners.
Three Tabs
The results page has three tabs:
- Full Results (default) — Detailed card-based view showing each runner with position, silks, beaten distance, jockey, trainer, in-running comment, and starting price
- Rating Changes — Compact table showing RaceMetrics rating changes for all 7 participant types (Horse, Trainer, Jockey, Sire, Dam, Damsire, Owner)
- Race Workout — Analyses how the race has worked out by tracking what all runners did in their subsequent races. See Race Workout for full details
Full Results Tab
Each runner is displayed as a card showing:
- Position: Finishing position with ordinal suffix (1st, 2nd, 3rd, etc.) — gold for 1st, silver for 2nd, bronze for 3rd. Non-finishers show PU, FE, UR, etc. in red
- Silks: Jockey colours
- Distance: Distance to next horse in lengths (nse = nose, shd = short head, hd = head, nk = neck, ½ = half length, etc.)
- Card No. (Draw): Racecard number and stall draw position
- Horse: Horse name (click to open profile)
- Age: Horse age in years
- Weight: Weight carried in stones-pounds (e.g. 9-7)
- SP: Starting price odds
- J: / T: Jockey and Trainer names (click to open profiles)
- Comment: In-running comment describing how the horse ran
Rating Changes Tab
The rating changes table shows all runners sorted by finishing position:
- Pos: Finishing position — 1st (gold), 2nd (silver), 3rd (bronze), or DNF statuses like PU (pulled up), FE (fell), UR (unseated rider)
- Silks: Jockey colours for visual identification
- Horse: Horse name — click to open profile
- H: Horse rating change (green for gains, red for losses)
- SP: Starting price odds
- Trainer / T: Trainer name and rating change
- Jockey / J: Jockey name and rating change
- Sire / S: Sire name and rating change
- Dam / D: Dam name and rating change
- Damsire / DS: Damsire name and rating change
- Owner / O: Owner name and rating change
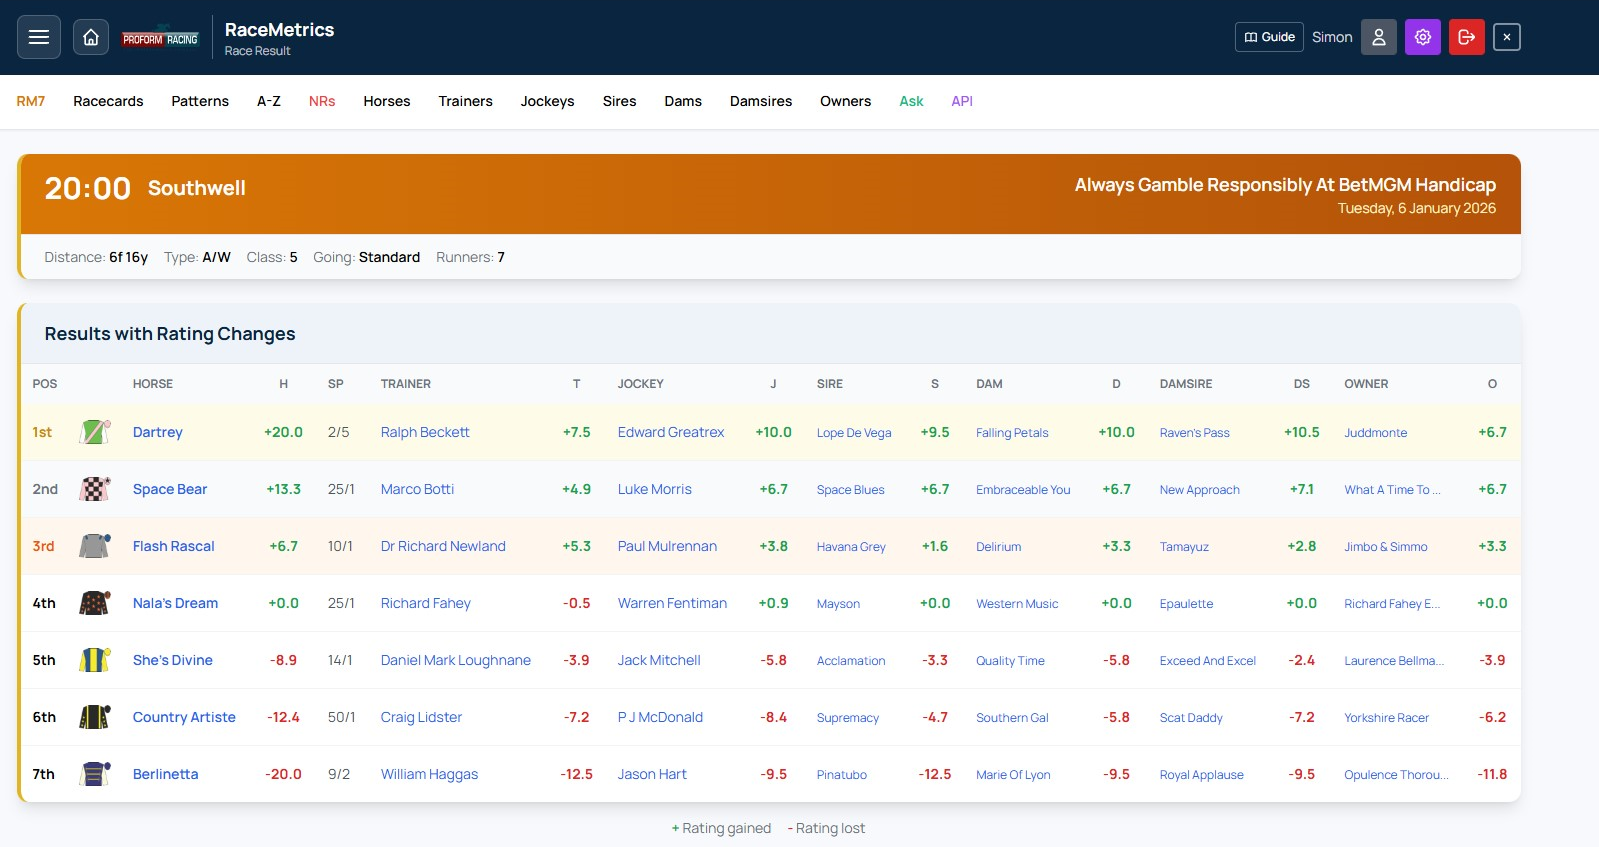
Race results showing finishing positions, SP, and rating changes for all 7 participant types
Rating Changes Explained
Each participant column shows how their RaceMetrics rating changed as a result of this race:
- +X.X (Green): Rating increased - performed above expectations
- -X.X (Red): Rating decreased - performed below expectations
- - No change or data unavailable
The winner typically gains the most points, with gains reducing for lower positions. Rating changes depend on the quality of opposition and pre-race expectations.
Row Highlighting
- Yellow tint: 1st place finisher
- Light grey: 2nd place finisher
- Light orange: 3rd place finisher
Non-Finishers
Horses that didn't complete the race show their status in red:
- PU: Pulled up by jockey
- FE: Fell
- UR: Unseated rider
- BD: Brought down
- RR: Refused to race
- DNF: Did not finish (other reasons)
Navigation
- Hamburger Menu: Access other races from the same day or different dates
- Recent Profiles: Click the left-edge tab to see recently viewed profiles
- Profile Links: Click any name (horse, trainer, jockey, etc.) to open their full profile
- Close: Use the X button in the header to close the results popup
Sectional Analysis (Platinum + Sectionals)
For races with sectional data available, a purple "Sectional Analysis" expandable section appears below the results. Click to expand and access:
- Sectional times at each furlong marker
- Speed percentages and positions
- Running style classifications
- Distance DNA on horse profiles — stride-cadence trip suitability vs winning horses at each distance
- "Full of running" flags — beaten horses that crossed the line with plenty left, badged on racecards until they run again
See the Sectionals section for full details on this feature.
View Racecard (Historical Analysis)
Click the View Racecard button in the results header to open the original racecard for this past race. This powerful feature lets you see exactly what the data looked like before the race was run:
- Pre-race ratings: All RaceMetrics scores (Horse, Trainer, Jockey, etc.) as they were before this race affected them
- Pace predictions: Predicted Running Styles based only on sectional data from races prior to this one
- Form Expert stats: All historical statistics use only data from before this race date
This is invaluable for:
- Reviewing analysis: See what information was available when you made your selections
- Understanding rating changes: Compare pre-race ratings with post-race results to see impact
- Learning from past races: Study historical patterns with authentic pre-race data
Race Workout analyses how a past race has "worked out" by examining what the runners did in their subsequent races. It answers the question: did the form from this race prove strong or weak?
How to Access
- From Race Results: Open any race result and click the Race Workout tab (third tab, after Full Results and Rating Changes)
- From Inline Form Lines: In the form lines table, click the trend icon (the third icon in each row) to jump directly to the Race Workout for that race
The workout data is loaded on demand when you first click the tab, so there is no delay on the main results page.
Control Bar
Four controls let you adjust the analysis:
- Min runs: Minimum number of subsequent runs a horse must have to qualify (1–10, default 1). Increase this to focus on horses with a meaningful sample of follow-up races
- Max runs: Maximum number of subsequent runs counted per horse (1–10, or All, default 3). Lowering this focuses on immediate follow-up form; raising it captures longer-term trends
- Horses: Filter which original runners to include — All (every finisher), Winners Only (just the winner), or Win & Placed (1st to 4th)
- Within: Filter by distance beaten — All, or only horses that finished within 3L, 5L, 10L, or 15L of the winner. This filters instantly without re-fetching data
Your control bar choices are saved automatically and persist when you return to Race Workout later.
Summary Cards
Two summary panels appear at the top, giving an at-a-glance view of subsequent performance:
- All Runners — Aggregated stats for every qualifying horse from the original race
- Top 3 Finishers — Stats for only the first three home, useful for gauging whether the principals franked the form
Each panel shows:
- Horses: Number of qualifying runners
- Runs: Total subsequent runs counted
- Wins: Total subsequent wins (amber)
- Places: Total subsequent places (blue)
- Avg PRB: Average Percentage of Rivals Beaten across subsequent runs (green if 50%+)
- Net OR: Net Official Rating change (green if positive, red if negative)
- Avg H: Average RaceMetrics Rating of the qualifying horses
- Net H: Net RaceMetrics Rating change since the original race (green if positive, red if negative)
- SR: Top 3 speed ratings from subsequent runs (gold, silver, bronze pills)
Track Runners
Two buttons below the summary cards let you save horses as tracked patterns:
- Track All Runners: Saves a pattern for every qualifying horse in the workout
- Track Top 3: Saves a pattern for the top 3 finishers only
Tracked horses will be highlighted on future racecards via the Pattern Manager, helping you follow up on strong (or weak) form.
Per-Horse Breakdown Table
Below the summary, a detailed table shows each horse individually:
| Column | Description |
|---|---|
| Pos | Original finishing position (1st, 2nd, 3rd, etc.) |
| Horse | Horse name (click to open profile) |
| Dist | Distance beaten in lengths (behind the winner) |
| Runs | Number of subsequent runs counted |
| Wins | Subsequent wins (amber if any) |
| Places | Subsequent places |
| Avg PRB | Average Percentage of Rivals Beaten in subsequent runs |
| OR | Official BHA Rating at the time of the original race |
| OR +/- | Change in Official Rating since the original race (green = raised, red = lowered) |
| H | RaceMetrics Rating at the time of the original race |
| H +/- | Change in RaceMetrics Rating since the original race (green = improved, red = declined) |
| Best SR | Best Proform speed rating achieved in subsequent runs |
Row Highlighting
- Gold tint: 1st place finisher
- Silver tint: 2nd place finisher
- Bronze tint: 3rd place finisher
Key Metrics Explained
- PRB (Percentage of Rivals Beaten): Calculated as
(field size - finish position) / (field size - 1) × 100. A score of 100% means the horse won; 0% means it finished last. Horses that did not finish (pulled up, fell, etc.) score 0% - OR Change: The difference between the horse's Official Rating at its most recent subsequent run and its rating at the original race. A positive change suggests the handicapper has raised the horse, often reflecting strong form
- H Change: The difference between the horse's current RaceMetrics Rating and its rating at the time of the original race. This captures the overall trajectory since that run
- Best SR: The highest Proform speed rating from the horse's subsequent runs — a high figure suggests the horse has run to a strong level since
Future Form is an Enterprise-exclusive feature that answers a powerful question: how strong is the recent form behind each horse in this race? It builds on the Race Workout concept, but instead of analysing a single past race, it analyses the last 3 races for every runner in the race you are viewing, all in one place.
How It Works
For each runner in the racecard:
- The system finds the horse's last 3 completed races
- For each of those races, it fetches the Race Workout data — what all the other horses from that race did in their subsequent runs
- It aggregates this into a single Future Form Score (0–100) for each runner
A high FF Score means the horse has been racing against opponents who have gone on to perform well, and the horse itself performed well in those races. A low score suggests the horse has been running in weaker company or performing poorly against whatever company it has faced.
How to Access
Open any racecard and click the purple Future Form tab (fourth tab, after Ratings, Form Expert, and At-a-Glance). The data loads on demand the first time you click the tab. For Enterprise users, it is also preloaded in the background for instant access.
Tier access: Enterprise subscribers see full data for all runners. Lower tiers see the tab with the first horse shown as a sample and the rest locked behind an upgrade prompt.
The Future Form Score (0–100)
The FF Score is the headline metric. It combines two equally weighted components for each prior race:
FF Score = 50% Race Quality + 50% Own Performance
- Race Quality (0–50 points): The average PRB of all other runners from that race in their subsequent runs. If opponents went on to beat lots of rivals in later races, the race quality is high.
- Own Performance (0–50 points): The horse's own PRB (Percentage of Rivals Beaten) in that prior race. Winning scores 100% PRB (50 points); finishing last scores 0%.
When a horse has multiple prior races, the scores are weighted by recency:
| Prior Races Available | Weights (most recent first) |
|---|---|
| 3 races | 50% / 30% / 20% |
| 2 races | 60% / 40% |
| 1 race | 100% |
Worked Example
Suppose a horse's last 3 races scored as follows:
| Race | Own PRB | Others' Avg PRB | Race Score |
|---|---|---|---|
| Most recent (50% weight) | 90% (won) | 48% | (48/100×50) + (90/100×50) = 69.0 |
| 2nd most recent (30%) | 60% (3rd) | 35% | (35/100×50) + (60/100×50) = 47.5 |
| 3rd most recent (20%) | 80% (2nd) | 52% | (52/100×50) + (80/100×50) = 66.0 |
This horse scores 62.0 — strong recent form backed up by solid race quality.
Control Bar
Two controls let you adjust the analysis:
- Prior Races: How many recent races to look back per horse (1, 2, or 3, default 3). Reduce to 1 to focus purely on the most recent run
- Max Subsequent Runs: How many subsequent runs per horse are counted in each race's workout (3, 5, or All, default 3). Increasing this captures longer-term form but may dilute strong immediate follow-up
Your choices are saved automatically and persist between races.
Summary Cards
Four pills at the top give a quick overview:
- Avg FF Score: The average Future Form Score across all runners (green if 50+)
- Strongest Form: The horse with the highest FF Score (amber)
- Avg Race Quality: The average "others' PRB" across all analysed prior races
- Data Coverage: How many prior races had enough subsequent data to analyse (e.g., "35/36")
Per-Horse Table
The main table shows each runner with these columns (all sortable by clicking headers):
| Column | Description |
|---|---|
| # | Racecard number |
| Horse | Horse name with silks (click to open profile) |
| H | Current RaceMetrics Rating (gold highlight = highest in the race) |
| FF Score | Future Form Score (0–100, gold highlight = highest). The main metric — see scoring explanation above |
| Races | How many prior races were analysed vs requested (e.g., "3/3" or "2/3" if the horse has fewer than 3 prior runs) |
| Others PRB | Average PRB of opponents from the horse's prior races in their subsequent runs (green if 50%+) |
| Others Win% | Win rate of opponents from prior races in their subsequent runs (amber if above 15%) |
| Own PRB | The horse's own average PRB across its prior races |
| Best SR | Best Proform speed rating achieved by opponents in their subsequent runs |
Expandable Race Detail
Click any horse row to expand a detailed breakdown of the 1–3 prior races that make up its score. Each prior race shows:
- Header: The horse's finishing position, field size, course, date, class, distance and going (e.g., "2nd of 12 — Ascot, 14 Mar 26, C2 Hcap 1m2f Good")
- Race Score badge: The individual race's contribution to the FF Score, colour-coded green (60+), amber (40–59), or red (below 40)
- Workout pills: Horses, Runs, Wins, Places, Avg PRB, Best SR, and Own PRB for that race's workout data
- Full workout link: Click "View full Race Workout" to open the complete workout analysis for that race
Interpreting the Data
- High FF Score + High Own PRB: The horse has been winning or placing in races where the beaten horses have gone on to perform well. This is the strongest indicator of high-quality form
- High FF Score + Low Own PRB: The horse has been in strong races but finishing behind. The quality of opposition is there, but the horse itself may need to improve
- Low FF Score + High Own PRB: The horse has been beating weak opponents. It may have been flattered by the level of competition
- Low FF Score + Low Own PRB: The horse has been performing poorly in weak races. Concerning form
Caching & Performance
Future Form uses a batch query approach to analyse up to 45 prior races in a single database call, typically returning results in under 2 seconds. Results are cached server-side for 30 minutes, so multiple users viewing the same race get instant results. For Enterprise users, the data is also preloaded in the background as soon as the racecard opens.
What is Collateral Form?
Collateral form compares runners who haven't met directly by looking at how they've performed against shared opponents. If Horse A beats Horse C by 3 lengths, and Horse B loses to Horse C by 2 lengths, collateral form suggests Horse A has a 5-length advantage over Horse B.
RaceMetrics takes this further by adjusting for weight carried, race class, and recency to produce weight-adjusted collateral verdicts for every pair of runners.
The 3D Network Graph
Collateral Form presents connections as an interactive 3D force-directed network that you can rotate, zoom, and explore:
- Large coloured nodes represent today's runners (each runner gets a unique colour with their card number)
- Smaller grey nodes are shared opponents — horses not in today's race that two or more runners have previously faced
- Green edges mean the runner beat the opponent in their shared race
- Red edges mean the runner lost to the opponent
- Gold edges indicate a direct head-to-head (two of today's runners met in a previous race)
- The larger an opponent node, the more of today's runners it connects — making it a more important "link horse"
How to Use
- Open any racecard and click the Collateral tab (after Future Form)
- Drag to rotate the 3D graph, scroll to zoom in/out
- Hover over a runner node to highlight all its connections (other nodes dim)
- Click a runner node to open the side panel showing all pairwise verdicts against other runners
- In the side panel, click any matchup to expand and see the individual race details
Controls
- Period: Filter how far back to look for shared opponents (6 months, 1 year, 2 years, or all time)
- Min Links: Only show opponents that connect at least this many runners (2+ or 3+). Higher values reduce clutter
- Reset View: Return the camera to the default position and clear any highlights
- Labels: Toggle horse name labels on or off for a cleaner view
- 3D Graph: Toggle the 3D network on or off. When off, only the side panel and rankings table are shown — useful on slower devices or if you prefer the tabular data. Your preference is remembered across sessions via localStorage
Weight-Adjusted Verdicts
The side panel shows verdicts adjusted for weight carried using a distance-variable lbs per length scale, reflecting the fact that a length is worth more at shorter distances where the pace is faster:
- 5f: 3.5 lbs per length
- 7f: 3.0 lbs per length
- 1m: 2.9 lbs per length
- 10f: 2.4 lbs per length
- 12f+: 2.0 lbs per length (aligned with BHA standard)
Jumps Distance Normalisation
Beaten distances in jumps races are naturally much wider than on the flat — the average beaten distance in a hurdle (~25L) is almost 3x that of a flat race (~9L). To prevent jumps collateral verdicts being misleadingly inflated, beaten distances are normalised to a flat-equivalent scale:
- Flat (5f-8f): No adjustment (baseline)
- Flat (10f+): Slight reduction (0.85x at 10f, 0.75x at 14f+)
- Chase: 0.45x — a 20L beaten distance counts as ~9L
- Hurdle: 0.38x — a 25L beaten distance counts as ~9.5L
- NHF: 0.33x — a 30L beaten distance counts as ~10L
This means collateral advantages are comparable across codes — a +5L verdict in a hurdle carries similar significance to a +5L verdict on the flat.
In addition to weight and distance normalisation, the following factors are applied:
- Positive values (green) mean the selected runner has a collateral advantage
- Negative values (red) mean the opponent has the edge
- Confidence is based on how many data points exist: High (5+), Medium (2-4), Low (1)
- Race class and recency are factored in — recent races and higher-class races carry more weight
Date-Anchored Analysis
When viewing a past race, the collateral form only considers form before that race took place — giving you an accurate picture of the information that was available at the time. For upcoming races, all available form is included.
Rankings Table
Below the graph, a summary table ranks all runners by their net collateral advantage across all pairwise matchups. This gives a quick overview of which horse has the strongest collateral form in the field.
Tips for Best Results
- Competitive handicaps produce the densest networks — experienced runners with many runs will have more shared opponents
- Group races tend to show strong collateral links since elite horses frequently face each other
- Maiden races will often have sparse connections since horses have fewer previous runs
- If the graph looks sparse, try extending the period to "2 years" or "All time"
- Direct head-to-head meetings (gold edges) are the most reliable form evidence
Sectional Profile is a racecard tab that shows, for every runner in the race, a stride & sectional snapshot taken from their most recent past race of the same type (Turf, All-Weather, Chase, Hurdle or NHF). It brings stride, sectional and draw/pace analysis into a single field-wide comparison — a generalised, every-race version of our Epsom Classics showcase.
The idea: speed = stride length × cadence
A galloping horse’s speed is simply how far it travels with each stride (stride length) multiplied by how many strides it takes each second (cadence). A horse can go faster two ways — by lengthening its stride or by quickening it — and the balance it strikes tells you a great deal about the type of horse you are looking at.
The best gallopers cover the ground with a long, efficient stride and the ability to switch off — settling into a low, even rhythm early so there is energy left to quicken at the finish. Sprinters lean the other way: a faster cadence and a shorter, sharper stride. Neither is “better” in the abstract — what matters is whether a runner’s natural profile fits today’s trip, ground and likely pace.
Reading the figures
- ASL — average stride length (feet). How much ground each stride covers, typically around 22–26ft. It is flattered by fast ground, downhill sections and a steady early gallop, so always read it against the race it came from. A long, sustained stride is associated with class and stamina; a markedly short one often points to a speed type, or a horse under pressure.
- Cad — cadence (strides per second). The rhythm of the gallop, usually around 2.0–2.4. High cadence with a short stride is a speed signature; a lower, even cadence over a longer trip shows a horse that relaxes and conserves — the hallmark of a true stayer.
- Max — peak stride length (feet). The longest single stride the horse reached in the race. A wide gap between Max and ASL means it had another gear in hand when asked.
- FSP% — finishing speed %. How fast the horse finished relative to its own average speed for that race. Above 100% means it actually accelerated late — stamina in reserve and a well-judged ride. Below 100% means it was slowing through the line, which can simply reflect a hard-run race or a stiff climb rather than a flaw.
- Style — likely run-style (Led / Prominent / Held Up), from the horse’s recent sectional history. Draw IV and Tactical then place that style in the context of today’s course, distance and draw (see Draw & Pace below).
Putting it together — what to look for
The figures are at their most powerful in combination. A few patterns worth recognising:
- Long stride, FSP% under 100, still won well — a horse that dominates on raw cruising speed. It often wants to bowl along, and can be vulnerable to a proven closer if the early pace is strong.
- Modest stride, FSP% well over 100, held-up style — a classic closer whose weapon is the finish. It needs a genuine pace to aim at, and a draw or trip that lets it get cover and a clear run.
- High cadence, short stride — a speed type; usually seen to best effect at sharp trips and on tracks that reward early position.
- A stride that lengthens through the race and peaks late (visible in the stride map) — a horse staying on strongly, often value when stepping up in trip.
Two caveats keep the read honest. Every figure is shaped by the ground, the track and how the race was run, so compare like with like — which is exactly why this tab draws each runner’s figures from their last race of the same type. And one run is only a snapshot — the strongest signals are the ones a horse repeats.
The stride map
Tap any runner to expand a furlong-by-furlong chart of its stride length and cadence through that race. The shape is what matters: a stride that holds or lengthens in the closing furlongs (rather than shortening) shows a horse galloping right through the line, while a late drop-off in both lines marks the point at which it emptied. Read it alongside FSP% — the chart shows you where in the race the finishing effort came.
Pace Curves — how today's course & distance is typically run New
Different tracks make races unfold in genuinely different ways. Ascot’s stiff six furlongs grinds finishers down, so speed falls away steadily all the way to the line; Lingfield’s all-weather six is run at a far more even tempo, with the field still travelling close to full speed at the post. The Pace Curves chart shows that signature for today’s course & distance — its par line — and lets you lay other courses, and a runner’s own recent races, over it on one fixed scale.
Reading the chart. The vertical axis is “% of race-average speed”: 100 means a runner travelling at its own average speed for the whole race, above 100 faster than its average, below 100 slower. Because every line is measured the same self-contained way, shapes can be compared directly across courses, going and class — which is the whole point. Curves are anchored at the winning post, so a 5f curve simply occupies the right-hand side of a 6f chart and the closing stages line up. The opening furlong is always excluded: it contains the standing start and tells you nothing about pace shape.
What the par line is. The median (middle value) section-by-section of horses that finished in the first three, in truly-run races only — races whose winner ran at least to the speed figure expected for the class, filtering out the crawl-and-sprint tactical affairs that would distort the picture. The shaded band around it is the middle 50% of those races, and the Winning line toggle adds the winners-only version — how the horses that actually win here tend to distribute their effort.
The badges keep it honest. Every par line shows the number of races behind it. The line loads at today’s going and class first; when that exact combination is too thin to trust we widen the filters step by step and say so — class widened, going widened, all going blended (that one does mix soft-ground shape in), and small sample when even the widened line is built on few races. Fast and Good ground produce near-identical shapes, so merging those costs almost nothing; genuinely soft ground steepens the late fade and is never quietly blended in.
Using it. Two natural moves. First, compare another C&D: if a speedy sort keeps getting found out on a stiff finish, add a flatter track’s par and you can see at a glance the shape it would rather be racing to. Second, overlay a runner: pick one from today’s field and tick any of its recent same-code runs — a horse whose lines keep tracking today’s par is doing here exactly what the track asks; one that only holds its speed on flat-tempo curves is telling you something too. Two controls widen that read: More runs extends the list from the 6 most recent runs to 12, and Ran well only keeps just the runs where the horse beat at least half the field — a poor run tells you little about how a horse likes to travel, and filtering them out also reaches further back through the form to find the good ones.
One caveat keeps the read honest: shape fit is a lens, not a verdict. A horse can match today’s curve stride-for-stride and still be outclassed, and a falsely-run race can make any horse’s line look strange. Read it alongside class, form and the rest of the tab.
Course stride fingerprint New
Tracks don’t just shape pace — they shape movement. An uphill finish shortens strides; a flat, galloping all-weather surface lets horses stretch out. The fingerprint chart shows the typical stride-length range recorded at this course over these trips (the shaded band — average plus/minus one standard deviation, from truly-run races), with each of today’s runners plotted on it by their own career average stride. Hollow dots mean fewer than four measured runs — too little to weigh confidently.
A runner sitting well outside the band has an action quite unlike the typical stride here — worth a second look in either direction. And when you add a Compare another C&D line in the Pace Curves above, that course’s typical stride range appears on the fingerprint too (in teal, labelled with the course), so you can see at a glance where the comparison course moves differently from today’s — a track whose band sits clearly longer or shorter than today’s is asking for a different action. As with all stride data, treat it as a suitability guide alongside the pace curves, not a standalone predictor: it describes how a horse and a track move, and our own testing shows raw stride figures carry no betting edge on their own.
Draw & Pace in the tab
The same analysis from the dedicated Draw & Pace tab is summarised at the top of Sectional Profile: the likely race pace, the course’s favoured draw and running style (its “Course DNA”), and a per-runner Draw IV and Tactical score. A gold-ringed draw is one sitting in a historically winning draw-and-pace sweet spot for this course and distance.
Column reference
- Last same-type race – the race the figures are taken from (name, course, date, finishing position).
- ASL ft · Cad · Max · FSP% – the stride & sectional figures explained above.
- RM – the horse’s current RaceMetrics rating.
- Style · Draw IV · Tactical – run-style and tactical context (gold = best in race; Draw IV of 1.00 = neutral).
Tap any column heading to sort the field by it. On phones the table keeps the headline columns — rotate to landscape, or use a larger screen, for the full set.
Access
- Available with a Proform Premium subscription plus the Sectionals add-on.
- Open any racecard and choose the Sectional Profile tab. Without the add-on you'll see a preview and an upgrade prompt.
- This feature is in Beta — use the Share feedback button in the tab to tell us what you'd like to see.
Note on coverage: a runner only appears with figures if it has run a race of the same type that carries sectional data. First-time-over-a-discipline runners, and older form from before full sectional coverage, show “No same-type sectional run yet”. Sectional & stride coverage now spans every UK racecourse.
The Hard-Luck Finder is a screener for beaten horses the sectional data says should have won — before they line up again. Find it under Racecards → Hard-Luck Finder in the navigation, or go straight to hard-luck.html.
The two angles
- Hard-luck stories — TPD sectional timing works out how many pounds each horse left behind by running one section of its race inefficiently (checked, forced wide, or burned up in a speed duel). When correcting that one section would move a beaten horse to first place — with the whole field corrected the same way, so it’s a genuinely high bar — that run is flagged as a hard-luck story. Historically these horses win about 19% of the time next start against an ~11% baseline, finish in the first three around half the time, and show a small but genuine edge at Betfair SP — roughly +3–4% ROI net of commission over 7,000+ bets (modest on its own, better paired with a class drop or price filter).
- Full of running — the run-out speed angle: a beaten horse that posted a top-2 run-out speed (how fast it was still travelling two seconds after the line) and finished faster than par was never fully let down. These win 16.4% next time against a 10% baseline. This is the same signal behind the emerald FoR LTO racecard badge — the Finder gives it a list view.
How flags work
- Flags are computed automatically each evening as sectional data arrives (TPD data can land a couple of days after the race, so a fresh run may take a day or two to appear).
- A flag stays active until the horse runs again — the whole point is to catch it before its next start. Once it runs, the flag expires whatever the result.
- Each row shows the flagged run (course, date, finishing position, what the data says — e.g. “Corrected, wins by 2.5L”), how long ago it was, and the horse’s next declared engagement if it has one. Rows with an upcoming entry are highlighted and sorted first.
Where else it shows up
- Racecard badges: a rose Unlucky LTO badge next to any runner whose last run was a hard-luck story, alongside the emerald FoR LTO badge for full-of-running horses. Hover either badge for the numbers.
- Notifications: on mornings when flagged horses are declared to run, you’ll get an alert listing them (with the standard sectionals notification preference controlling it).
Access: the Hard-Luck Finder, the racecard badges and the declared-runner alerts need a Proform Premium subscription with the Sectionals Add On (they are built on TPD sectional data). Everyone can see the page and what it does; the data itself is gated. As with all sectional features, there is no Irish coverage.
What is Draw & Pace?
Draw & Pace is an Enterprise-exclusive racecard tab that cross-references historical draw position performance with running style (pace) data to identify tactical advantages for each runner. It answers the question: does this horse have the right draw for the way it likes to race?
For flat races, it analyses both draw bias and pace style. For jumps races (where there is no draw), it analyses pace style only.
How to Access
- Open any racecard and click the amber Draw & Pace tab (marked with an E badge for Enterprise)
- Data loads on demand the first time you click the tab and is cached for 30 minutes
Course DNA Banner
At the top of the tab, a summary banner shows the historically favoured draw group and running style at this course and distance — for example, "Low draws + Led style favoured at 1m (IV 1.58)". This gives you an instant overview of the tactical landscape before diving into the detail.
The draw bias is determined from aggregate LOW vs HIGH win rates (requiring at least 20 runs per group and a 30%+ difference). The pace bias uses the best-performing style from the Pace Style Stats table (requiring at least 30 runs and IV of 1.1+). This avoids small-sample outliers — the summary reflects broad, reliable trends rather than a single high-IV cell with few runs.
Pace Forecast
Based on every runner's historical running style, the system predicts whether the race is likely to be run at a strong, moderate, or slow pace. It counts how many runners are typically leaders, prominent, or held-up, and derives a pace forecast from the balance:
- Strong — 3 or more likely leaders; expect a fast early tempo that may suit closers
- Moderate — 1–2 leaders; the race is likely to be run at a fair tempo
- Slow — No clear leaders; may suit prominent racers who can steal a march
Running Styles
Every runner's historical pace profile is classified from the Proform database into three categories:
- Led — Typically races at or near the front from the start
- Prominent — Races handy, usually in the first third to half of the field
- Held Up — Typically races at the back and finishes strongly
The dominant style is determined from the horse's last 10 runs with recency weighting — the most recent run carries 10× the weight of the 10th-last run. This means a horse that has changed its running style in recent races will be classified by its current style, not diluted by old career history. The percentage shown indicates how dominant that style is in the weighted profile (e.g., "67%" means 67% of the weighted total).
Draw × Pace Heatmap (Flat Only)
The centrepiece of the tab is a 2×3 heatmap crossing draw groups (Low / High) with pace styles (Led / Prominent / Held Up). Each cell shows:
- Impact Value (IV) — The large number. IV above 1.0 means that combination wins more often than expected; below 1.0 means less often. Cells are colour-coded from deep green (high IV) through amber to red (low IV)
- Win% — Raw strike rate for that combination
- Runs — Sample size (more runs = more reliable)
- Runner silks — Jockey silks of today's runners overlaid on their cell, so you can instantly see who is in a sweet spot
Draw groups use a midpoint split matching the existing Meeting Pace page: draws 1 to ceil(fieldSize / 2) are Low, the rest are High.
A gold border highlights "sweet spot" cells where IV is 1.2 or above. These are historically strong combinations at this course and distance.
Impact Value by Stall (Flat Only)
Below the heatmap, a bar chart shows the historical IV for each individual stall position at this course and distance (5-year lookback, minimum 5 runs per stall). Bars are colour-coded:
- Deep green: IV 1.5+ (strong advantage)
- Green: IV 1.2–1.5 (moderate advantage)
- Light green: IV 1.0–1.2 (slightly above average)
- Amber: IV 0.8–1.0 (slightly below average)
- Orange: IV 0.5–0.8 (disadvantaged)
- Red: IV below 0.5 (strongly disadvantaged)
Runner card numbers are shown in the stall labels so you can see which stall each runner has been allocated. Jockey silks are displayed alongside horse names in the runner table.
Pace Style Stats
A table showing how each running style has performed at this course and distance over the last 5 years, including runs, wins, win percentage, and IV. This helps identify courses where front-runners dominate or where hold-up horses thrive.
Runner Tactical Table
The main runner table brings everything together. A Table / Visual toggle switches between a traditional table and a visual mode with stacked pace bars and heatmap-coloured IV cells. Both modes are fully sortable and the toggle preference is remembered via localStorage.
All columns are sortable by clicking the header:
| Draw | The runner's stall number (flat races only) |
| Draw IV | Historical Impact Value for their specific stall at this course and distance. In visual mode this is shown as a heatmap-coloured cell (green = advantage, red = disadvantage) |
| Pace | The runner's dominant running style from their last 10 runs, recency-weighted (table mode only — visual mode replaces this with the pace bar) |
| H% | Percentage of recent runs where the horse was Held Up. Sortable — click to find the most patient runners |
| P% | Percentage of recent runs where the horse was Prominent |
| L% | Percentage of recent runs where the horse Led. Sort descending to find the most likely leader |
| Pace IV | Blended Pace IV — a weighted average of all three style IVs at this course, using the horse's actual style distribution as weights (see below) |
| Tactical | Tactical Score — a distance-weighted composite of Draw IV and Pace IV (see below). Gold highlight = best in race |
| Zone | Whether the runner is in a Sweet Spot (draw-group + pace combo IV > 1.0) or a Dead Zone (IV < 0.8) |
Visual Mode
The visual mode replaces the Pace badge with a stacked pace bar for each runner, showing the proportion of their recent runs in each style:
- Blue (left) = Held Up — the back of the field
- Amber (middle) = Prominent — racing handy
- Red (right) = Led — at or near the front
The bar reads left-to-right as back-to-front, representing where the horse typically races in the field. Draw IV, Pace IV, and Tactical Score cells are displayed with heatmap background colours matching the matrix colour scale.
Tactical Score Calculation
The Tactical Score combines Draw IV and Pace IV using a distance-dependent weighted geometric mean, reflecting research that shows draw is more critical in sprints while pace becomes dominant over longer distances:
- Sprints (5–7f): Draw IV weighted 60%, Pace IV 40%
- Mile and beyond (8f+): Draw IV weighted 40%, Pace IV 60%
- Jumps races: Tactical Score equals Pace IV (no draw component)
A score above 1.0 suggests conditions favour the runner; below 1.0 suggests they face a tactical headwind.
Blended Pace IV
In any race, only 1–2 horses can lead, a few more race prominently, and the majority are held up. This means "Led" will always have fewer historical runs than "Held Up". While the course-level IV already accounts for this frequency difference, a naive approach of assigning each runner their dominant style's IV would give a horse that leads 38% of the time the same benefit as one that leads 90% of the time.
To solve this, the Pace IV uses a blended weighted average based on each horse's recency-weighted style distribution from their last 10 runs:
Pace IV = (% Led × Led IV) + (% Prom × Prom IV) + (% Held × Held IV)
The percentages come from the recency-weighted profile, not raw career totals. This means a horse that has recently switched from held-up to prominent will have its Pace IV reflect its current style.
For example, at a course where Led IV = 1.58, Prominent IV = 1.32, Held Up IV = 1.05:
- A horse that leads 90% of recent runs: Pace IV ≈ 1.53 (benefits fully from the Led advantage)
- A horse with 38% Led, 31% Prom, 31% Held recently: Pace IV ≈ 1.34 (partial benefit)
- A horse with 80% Held Up, 20% Prom recently: Pace IV ≈ 1.10 (mostly reflects Held Up conditions)
Persistence
Your chosen sort column, sort direction, and Table/Visual toggle are all remembered across races and sessions via localStorage.
Jumps Races
For jumps races (Chase, Hurdle, NHF), there is no draw, so the heatmap and per-stall chart are hidden. The tab shows the Pace Forecast, Pace Style Stats, and the Runner Table with Pace and Pace IV columns only.
Data & Methodology
- Course-level statistics (heatmap, stall chart, pace stats) use a 5-year lookback from the current date, matching the methodology used on the Meeting Pace page
- Runner pace profiles use the last 10 runs with linear recency weighting (most recent = 10× weight of oldest), ensuring current form takes priority over historical patterns
- Data is filtered to the same course, race type (Turf/A.W./Chase/Hurdle/NHF), and truncated furlong distance band
- Per-stall stats require a minimum of 5 runs per stall to be shown (avoiding unreliable small samples)
- The draw × pace matrix filters to historical races with a similar field size (at least 60% of today's runners) to ensure the LOW/HIGH split is meaningful
- Results are cached server-side for 30 minutes
What is the Going Predictor?
The Going Predictor is a live race time calibrator. After race 1 at a meeting, enter the winning time and instantly see which going condition the ground is actually riding as at that course and distance. The official going description doesn't always reflect reality — the Going Predictor gives you a data-driven verdict based on historical GA (Going Allowance) data.
How It Works
The Going Predictor uses Proform standard times and class normalisation to predict the going from a single race time. This is the same methodology used to create Proform Speed Figures.
- Select course and distance — the tool loads all historical race times and looks up the standard time (the expected winning time on Good ground)
- Choose race type — Turf, AW, Chase, Hurdle, or NHF. These are never mixed because each runs on different ground or a different part of the course
- Select race class — Class A through H. This is critical for accuracy as it normalises for horse ability (Class A races are run faster than Class G regardless of going)
- Enter the winning time in seconds (e.g., 84.19) or minutes:seconds format (e.g., 1:24.19) — both inputs sync automatically
- Optionally enter rail movement — in yards, positive or negative. Rail movements can add or remove distance from a race, sometimes up to nearly a furlong
- Get the verdict — the tool calculates DiffPerMile (how much slower than standard), applies the class normalisation, and maps the result to a going description
The Calculation
The prediction follows the Proform speed figure methodology:
- Standard Time Adjustment: If rail movement is entered, the standard time is proportionally adjusted:
adjStdTime = (stdTime / miles) × (miles + railYards/1760) - Diff per Mile:
(enteredTime - standardTime) / miles— how many seconds per mile slower than standard - Class Normalisation: Each class has a seconds-per-mile value (A=3.6, B=4.8, C=5.5-5.9, etc.) representing the expected speed relative to standard. Higher classes run closer to standard time
- Predicted GA:
ClassCalc - DiffPerMile— the going allowance after removing the class effect
Accuracy Notes
- This is a single-race estimate. Proform's actual GA uses the top 3 fastest races from a meeting for greater accuracy
- A confidence range of ±2 GA is shown to reflect the inherent uncertainty
- Slowly-run tactical races will read softer than reality — check race pace if available
- Class A and B races produce more reliable predictions than lower classes due to narrower ability ranges
- Without a class selected, the prediction omits the class normalisation and is less accurate
Race Type Isolation
Different race types run on different surfaces or different parts of the course, so times are never mixed:
- Turf (Flat) — turf flat races only. Goings: Hard through Heavy
- AW (All-Weather) — different surface entirely. Goings: Standard, Slow, Fast
- Chase — run on a separate part of the course from hurdle races
- Hurdle — hurdle races only
- NHF — National Hunt Flat races (run on the hurdle course with hurdles removed)
GA-to-Going Mapping
The verdict uses the Proform Going Allowance (GA) scale with granular descriptions beyond the standard BHA categories:
Turf / Jumps:
- Firm: GA +3.0 or higher
- Good to Firm: +2.01 to +2.99
- Good: -0.99 to +2.00
- Good to Soft: -1.0 to -3.49
- Soft: -3.5 to -4.99
- Very Soft: -5.0 to -6.49
- Heavy: -6.5 to -7.99
- Very Heavy: -8.0 to -9.49
- Extremely Heavy: -9.5 to -11.99
- Bottomless: -12.0 to -14.99
- Extremely Bottomless: -15.0 or worse
All-Weather: Fast (+3.0+) → Standard (0 to +2.99) → Slow (below 0)
Going Summary Cards
Colour-coded cards show each going condition found at the selected course and distance. Each card displays:
- Races: Number of historical races at this going
- Median: Median race time (more robust than average against outliers)
- Avg: Average race time
- Range: Fastest to slowest time
- Avg GA: Average Going Allowance (green = positive/fast, red = negative/slow)
Going data is grouped by actual going (post-race assessment) where available, falling back to official going when actual going is not recorded.
Rail Movement
Rail movements can add or remove distance from a race — sometimes up to nearly a furlong. Enter the movement in yards (positive = longer, negative = shorter) and the standard time is proportionally adjusted before the GA calculation runs. This is the same adjustment used when creating Proform Speed Figures.
Time Equalisation
At some courses, race distances vary by a few yards between meetings (e.g., Clonmel may have races at 2m 51y, 2m 76y, and 2m 95y all within the same distance band). The Going Predictor automatically equalises times to the most common distance:
- Times are proportionally adjusted:
adjustedTime = rawTime × (targetDistance / actualDistance) - Adjusted times are marked with an orange * in the table — hover to see the original time and actual distance
- The table header shows which distance times have been equalised to
- All analysis (verdict, scatter plot, going cards) uses the equalised times for accuracy
Date-Anchored Analysis
When accessed from a past race, the Going Predictor only shows historical times from before that race date. This means you see the same data that was available at the time, not results from after the race.
3D Scatter Plot
The interactive 3D scatter shows every historical race as a point:
- X axis: Going condition (categorical, ordered firm to soft)
- Y axis: Race time in seconds (equalised if applicable)
- Z axis: Going Allowance (GA)
- Point colour: By going condition
- Point size: Proportional to field size
- Gold diamond marker: Your entered time, positioned at the predicted going
- Hover any point to see date, winner, time, going, class, field size, and speed rating
Historical Races Table
A fully sortable table showing every race in the dataset with columns for date, winner, time (seconds and m:ss), official going, actual going, distance, class, field size, GA (colour-coded: green positive, red negative), GA Going (the granular going description derived from the GA value for that individual race), and speed rating.
When you enter a time, a gold "YOUR TIME" row is pinned at the top of the table showing the predicted going and GA for your entered time.
GA Column Colouring
GA values are colour-coded throughout: green for positive (faster than standard) and red for negative (slower than standard). This applies to the table, going cards, and verdict panel.
Confidence Levels
- High: 50+ races in the dataset and entered time is within 1 standard deviation of the nearest going cluster
- Medium: 20–49 races or within 1.5 standard deviations
- Low: Fewer than 20 races or beyond 1.5 standard deviations
Access
- Racecards menu: Choose Going Predictor from the Racecards menu in the navigation bar
- Racecard: Going Predictor button in the race info strip (pre-populates course, distance, race type, and official going)
- Race Results: Going Predictor button next to Meeting Pace
What is Trip Predictor?
Trip Predictor finds every horse's optimal trip — the conditions where they perform best. For any horse it analyses every prior run and surfaces preferred going, distance, class, surface and field size with confidence levels and a form trend. The aim is simple: when today's race fits the horse's optimal trip, you know.
Where to find it
- Open any horse's profile and click the Trip E tab in the profile tab bar (right after Command Centre).
- Available on horse profiles only — trainers, jockeys, sires etc. are out of scope by design.
The hero cards
The top of the tab shows a row of cards, each with the horse's optimal pick for one dimension and a confidence pill (high / med / low):
- Going (Turf) — best turf going (e.g. Soft, Good to Firm). Computed only over runs on turf.
- Going (Polytrack) — best going on Polytrack courses (Kempton, Lingfield, Chelmsford City, Dundalk).
- Going (Tapeta) — best going on Tapeta courses (Newcastle, Southwell, Wolverhampton). A horse may genuinely prefer one synthetic surface over the other, so we keep them separate.
- Distance — best distance band (e.g. 6f, 1m1f-1m2f, 2m1f-2m4f). Uses the same bands as Form Expert.
- Class — best race class (1 highest grade, 7 lowest).
- Surface — best surface preference: Turf vs Polytrack vs Tapeta vs Laytown.
Going cards are stratified by surface because turf goings (Soft, Good etc.) and AW goings (Standard, Slow) are not directly comparable — lumping them together would surface a misleading "optimal going" for any horse with mixed-surface runs. A card only appears if the horse has at least 3 runs on that surface.
The trend strip
Below the hero cards is a one-line summary:
- Total runs — how many finished runs the profile is built on (in this code).
- Confidence — the worst confidence across the optimal picks for going (best of the three surface dims), distance, class and surface. Field size is excluded (it's supplementary, not a core trip dimension).
- Trend — ↑ improving, → peak, ↓ declining, or ? unknown. Computed via linear regression on the horse's RaceMetrics Rating over the last 8 runs. Slope > +1.5 = improving, < -1.5 = declining, otherwise peak. Horses with fewer than 8 valid recent rating points get "unknown".
- Peak age — the age at which the horse's RaceMetrics Rating peaked (requires at least 2 runs at that age).
- Career PRB — recency-weighted average % of rivals beaten across all runs. Used internally as the Bayesian shrinkage prior.
- Best field — preferred field-size band (1-7, 8-15, 16+). Supplementary signal — some horses simply win more often when fields are weaker.
Breakdowns
Each dimension expands into a table showing every bucket the horse has run enough in (3+ runs minimum), with the optimal bucket marked with a gold star (★) and highlighted in green:
- Runs / W / P — runs, wins, places (places use the same field-size-aware cutoff as Race Workout: top 2 for 5-7 runners, top 3 for 8-15, top 4 for 16+).
- Avg PRB — raw recency-weighted average percentage of rivals beaten in this bucket.
- Shrunk — the same number after Bayesian shrinkage toward the horse's career mean (k=4 prior). This is what drives optimal-bucket selection — it stops a tiny lucky sample dominating.
- ΔRating — mean RaceMetrics Rating points gained per run in this bucket. Coloured green/red.
- Conf — sample-size based: low (3-5 runs), med (6-12), high (13+).
Multi-code horses
Some horses run across disciplines (e.g. a National Hunt horse with chase, hurdle and NHF runs). These are split into separate code profiles — you'll see CHASE / HURDLE / NHF buttons at the top of the tab, each with its own run count. Click any button to switch the entire view to that code's profile. Going cards, distance, class, breakdowns — everything updates.
How the algorithm works
- PRB (% rivals beaten) =
((field_size - finish_position) / (field_size - 1)) × 100. Non-finishers (pulled up, fell, unseated etc.) score 0. - Recency weighting — runs in the last 12 months count fully (1.0×), 12-24 months get 0.7×, anything older 0.4×. Captures the fact that a 3yo's form at age 8 isn't as relevant as last month's run.
- Bayesian shrinkage (k=4) — each bucket's average is pulled toward the horse's career mean PRB. Effect: a 3-run "best" bucket can't dominate a 20-run merely-good bucket without strong evidence.
- Trend slope — linear regression on RaceMetrics Rating over the last 8 finished runs. Requires the full 8-run window before reporting a slope, otherwise "unknown".
Confidence at a glance
- high — 13+ runs in the optimal bucket. The signal is reliable.
- med — 6-12 runs. Solid signal, treat as indicative.
- low — 3-5 runs. Take with a grain of salt — small samples can mislead.
Buckets with fewer than 3 runs are excluded entirely — we don't pretend to know something based on 1 or 2 races.
"No trip profile yet"
If a horse has too few runs in any single bucket (typically a horse with 3-4 lifetime runs spread across different goings, distances or classes) you'll see a No trip profile yet message instead of cards. This is the engine being honest — we'd rather say nothing than say something unreliable.
On the racecard: Trip Fit column
Every racecard view (Ratings, At-a-Glance, Form Expert in horse mode) gains a Trip Fit column showing how today's race conditions match each runner's optimal trip. The column is also click-to-sort on the Ratings view.
- Stars — filled stars = matching dimensions (going-by-surface, distance, class, surface). Empty stars (☆) = non-matching. The fit score is shown as
score / outOfe.g.3/4means 3 of 4 counted dimensions matched. - Star colour by ratio:
- ★★★★ emerald — every counted dim matches (ratio = 100%, e.g. 4/4, 3/3, 2/2)
- ★★★☆ cyan — most match (66%+, e.g. 3/4 or 2/3)
- ★★☆☆ amber — some match (40%+, e.g. 2/4 or 1/2)
- ★☆☆☆ gray — few or none (under 40%, e.g. 1/4, 1/3, 0/4)
- Hover — tooltip shows per-dim breakdown (today's value vs the horse's optimal) plus trend and runs.
- "low conf" — shown when no dimension reaches med+ confidence. Don't rely on a fit assessment until you've got reliable signal.
- "no data" — horse has too few runs to compute a profile.
Sorting tip: Click the Trip Fit header on Ratings view to sort by fit. The 1 / 2 / 3 rank badges stay on the Combined-Rating top 3 regardless of sort, so when you sort by Trip Fit you can spot the disconnect at a glance: if the gold-#1 horse is now down at row 6, that's the strongest horse on rating but a poor fit for today's conditions.
Best Fits view
Alongside Ratings / Form Expert / At-a-Glance there's a Best Fits view that ranks the field by how well today's race matches each horse's optimal trip:
- Top 3 get gold/silver/bronze rank badges and an amber row tint — here the badges DO reflect Trip Fit ranking (unlike the Ratings view above)
- Match Detail column shows ✓/✗ per dimension (Going / Dist / Class / Surf) with each horse's optimal value — you instantly see why the fit is what it is
- Trend arrow shows form direction: ↗ improving, → peak, ↘ declining, ? unknown
- Banner at the top reminds you what today's conditions are (surface, going, distance, class, field band)
- Excluded footer lists horses with no profile or low confidence so you know who's missing from the ranking and why
The view is sorted strictly by fit ratio — a 3/3 horse always beats a 3/4 horse. Combined RaceMetrics rating is shown for context but doesn't drive the order. This means the rating top pick can rank low here, which is the point: Best Fits answers "who suits these conditions?", not "who's the strongest horse?".
Best Fits Today (cross-race daily feed)
The standalone Best Fits Today page shows the day's top trip-fit picks across every race in one ranked table, with a date picker to look ahead at upcoming declared days, sortable columns, and filters by course / fit / trend. Past dates are deliberately blocked because the engine reads current profiles — showing yesterday's "fit" would use post-race results that weren't available before the race ran.
Confidence gating — why the fit score might be x/3 instead of x/4
The fit score only counts dimensions whose optimal pick has at least med confidence. If a horse only has 4 runs at their preferred class, that dim has low confidence and is silently excluded from the score — the denominator drops by 1.
Without this guard, a horse with one fluky 3-run "best class" would get a misleading green badge. The trade-off: you sometimes see denominators of 2 or 3 instead of 4 — that's a feature, not a bug. Hover the badge to see exactly which dimensions counted.
Tier & access
Trip Predictor (the profile tab and the racecard column / Best Fits view) is exclusive to the Enterprise plan and above. Lower tiers see the controls but get the upgrade prompt when they click. Admin users always have access for validation.
Handicap Analysis is a dedicated tab on every handicap racecard that surfaces three signals: Speed-Form vs class par, Mark Edge vs last winning OR, and a race-level Hot/Soft Index. All history is scoped to today's race-type only — Turf Flat, All-Weather, Chase and Hurdle are kept separate.
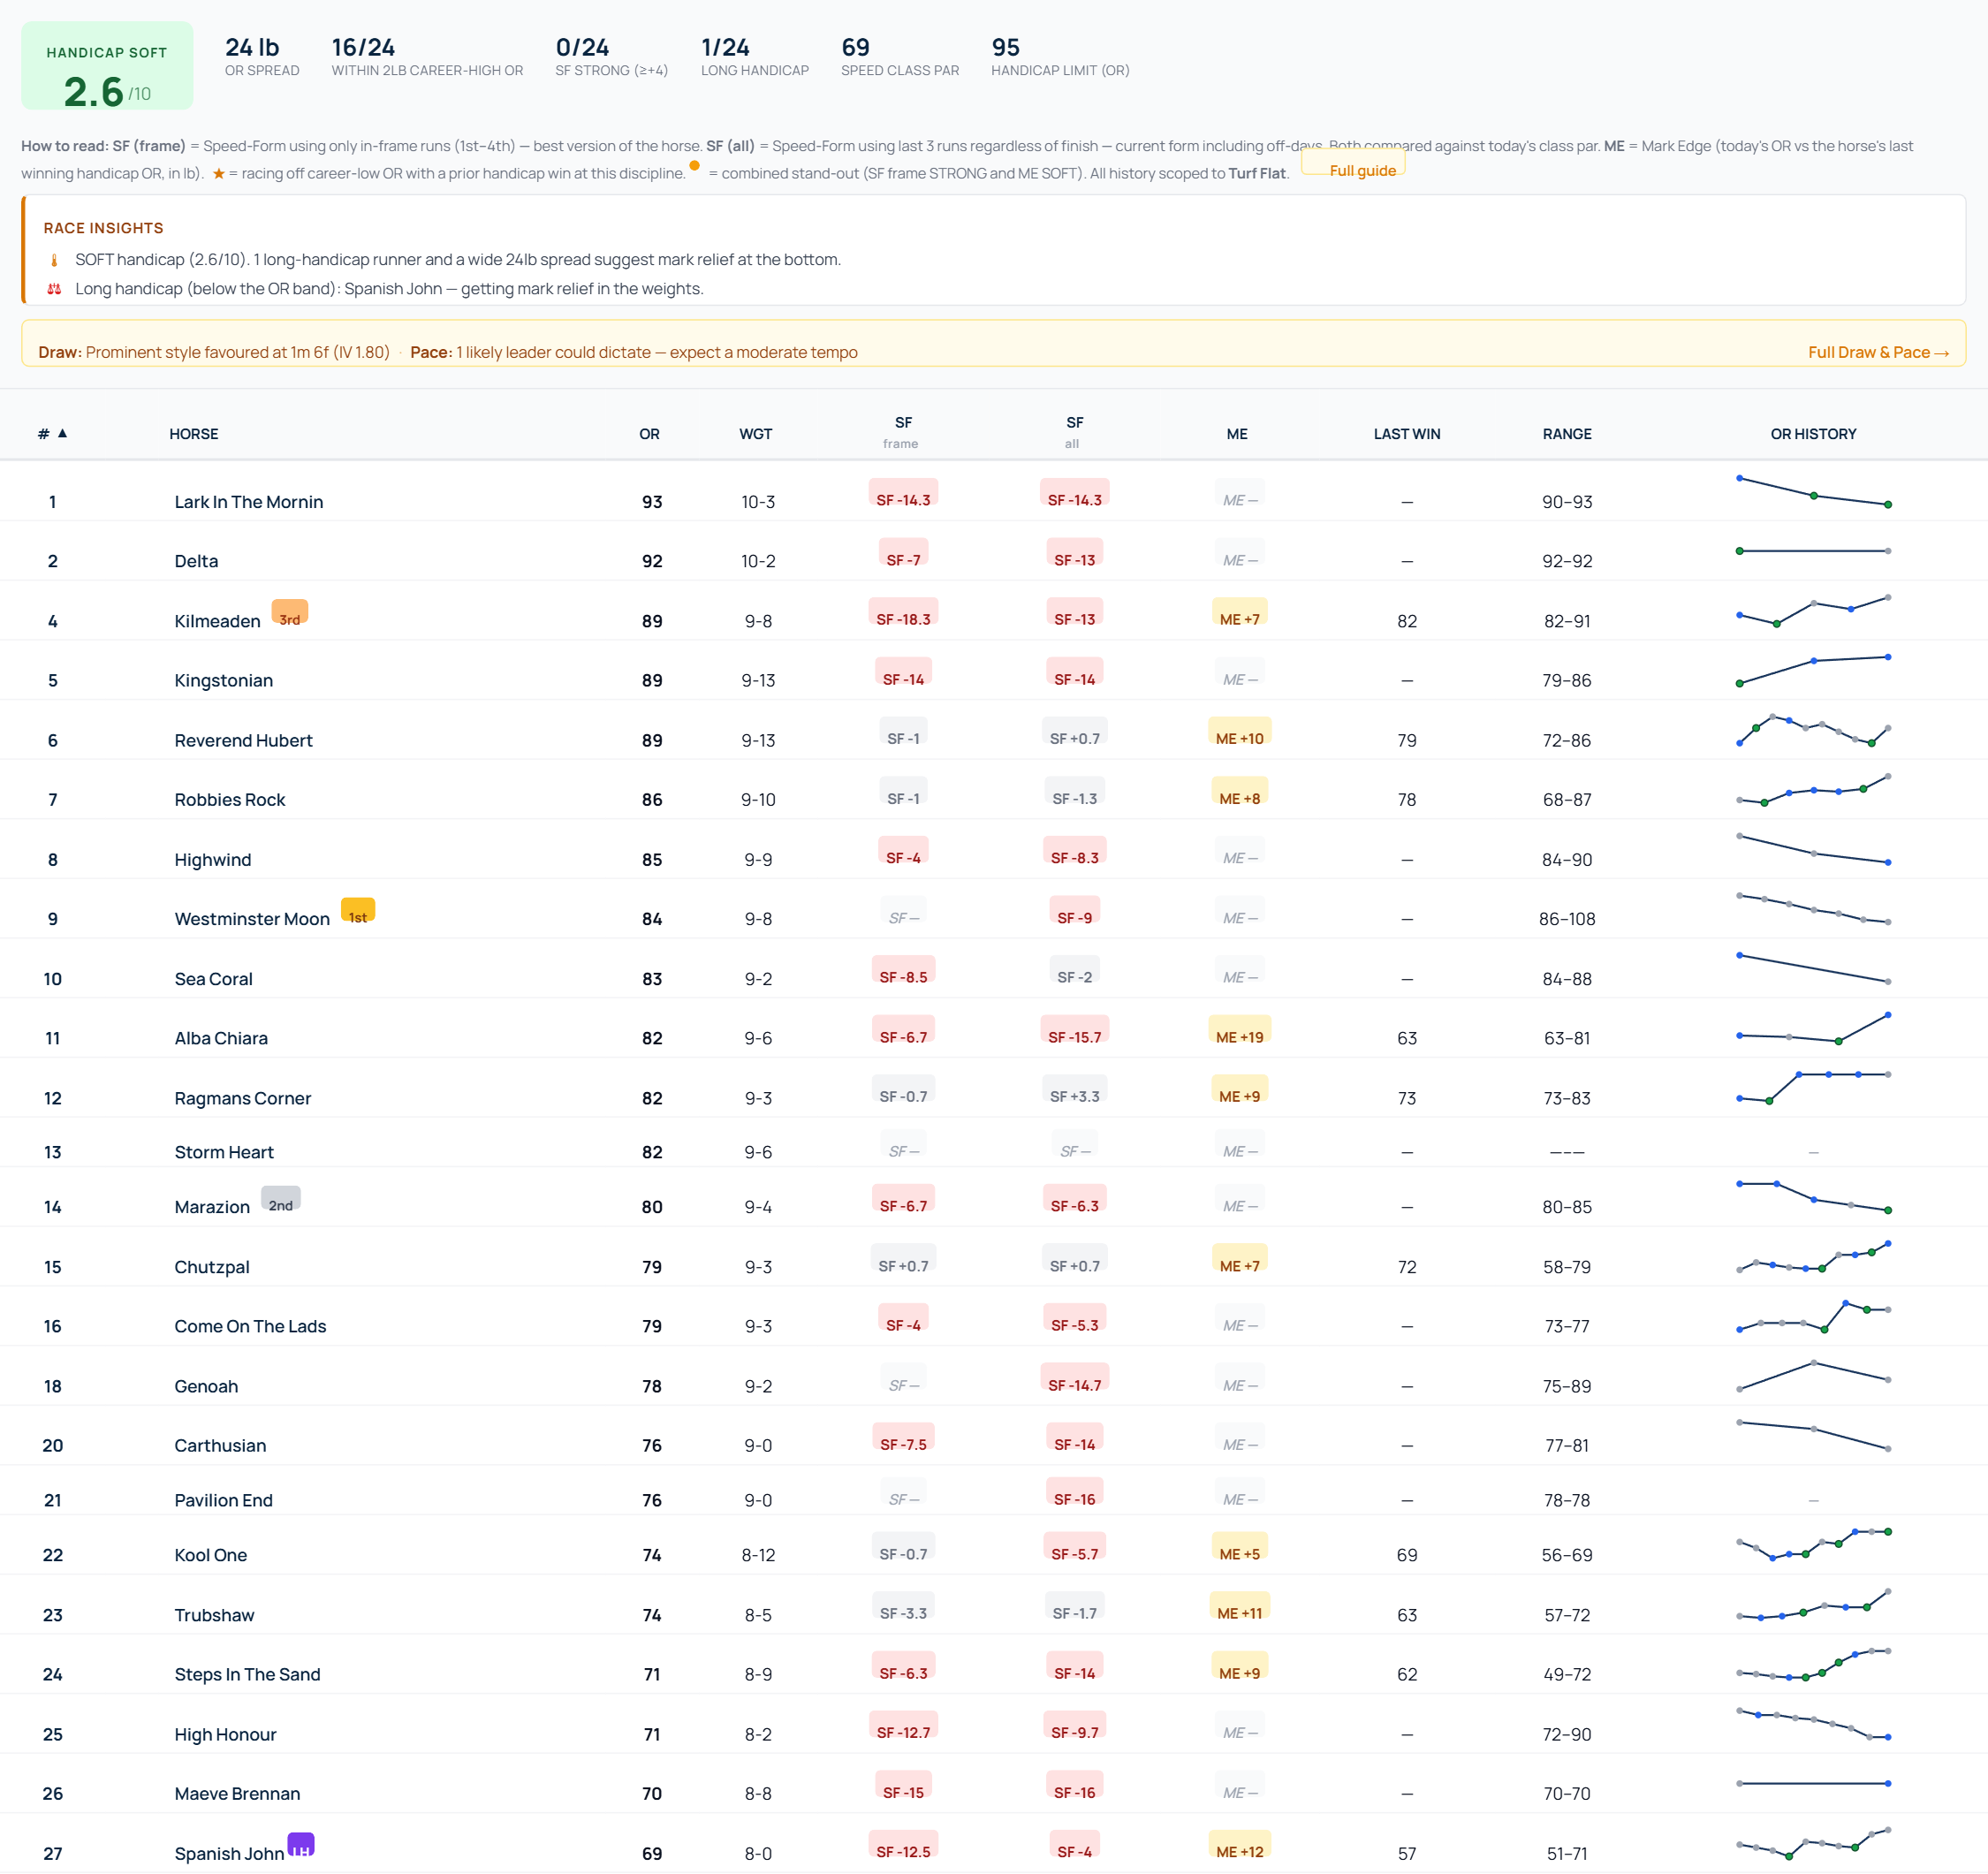
Race header — Hot/Soft Index
A 0–10 dial at the top of the tab summarises how competitive the handicap is, with three single-scale components feeding the score:
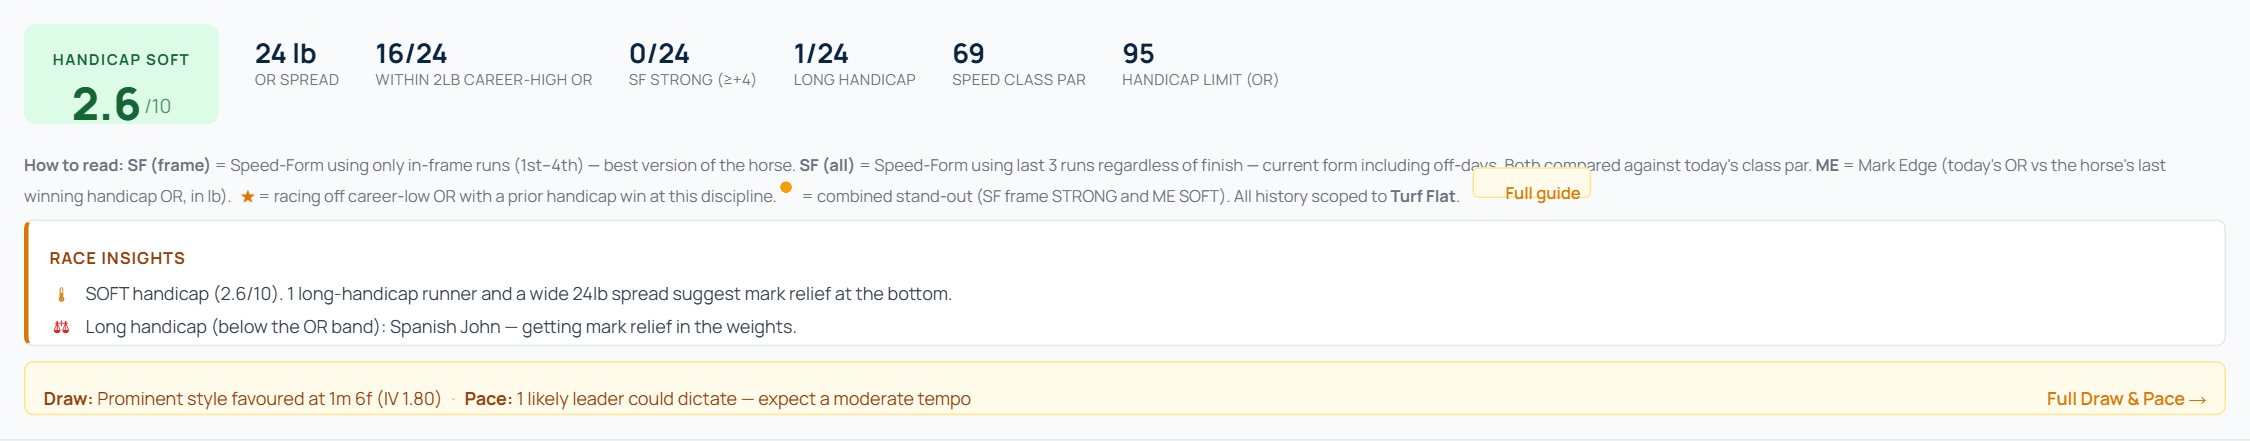
| Label | Score | Meaning |
|---|---|---|
| SOFT | 0 – 3.9 | Open at the bottom — top weights look vulnerable; well-handicapped runners lower in the weights have a real chance |
| WARM | 4 – 6.9 | Balanced — neither obviously open nor a tight competitive race |
| HOT | 7 – 10 | Competitive, tight, hard-to-call — runners bunched in OR and many in strong recent form |
The score is built from four components:
- OR spread (max OR – min OR in today's field) — wider = lower score (more spread = softer at the bottom)
- % within 2 lb of career-high OR — high % = higher score (exposed top end means real competition)
- % with SF STRONG (≥+4) — high % = higher score (lots of horses running fast = real class)
- # of long-handicap runners — high count = lower score (mark relief from below the band)
Race Insights (auto-commentary)
Right below the dial, an Insights panel surfaces 3–6 plain-English bullets — temperature explanation, combined stand-outs, career-low runners, the best speed-form runner, long-handicap callouts, and a "limited form" alert when the field has thin recent data.
Per-runner chips
Each runner row in the Handicap table has two adjacent chips:

SF — Speed-Form (two variants)
The runner row shows two Speed-Form columns side by side. Both use today's class par as the benchmark, both are scoped to the horse's runs at today's discipline only (Turf Flat / All-Weather / Chase / Hurdle), and both use the same tier thresholds — but they answer different questions.
SF (frame) — the original signal. Average speed figure of the horse's last 3 in-frame runs (positions 1st–4th) at today's discipline, minus today's class par. Filters out off-days and non-finishes, so it measures peak ability when the horse is firing. Best for spotting a horse with hidden class.
SF (all) — the recent-form signal. Average speed figure of the horse's last 3 runs at today's discipline regardless of finish position, minus today's class par. Includes bad runs, falls and pulled-ups, so it measures current general form. Useful for spotting horses that have gone off the boil even if their peak is high.
Read them together: when SF (frame) is high but SF (all) is low, the horse can run to class but isn't right now — be wary. When both are high, the horse is firing on all cylinders. When SF (all) is higher than SF (frame), the horse has had several finishes outside the frame recently — be sceptical of the "frame" version.
| Tier | Range | Meaning |
|---|---|---|
| STRONG | ≥ +4 | Recent times well above class par — in form |
| FAIR | −3 to +3 | Roughly running to class par |
| WEAK | ≤ −4 | Recent times well below class par — out of form |
Note: the combined gold-dot stand-out tag (●) uses SF (frame) STRONG + ME SOFT. The (frame) variant is the higher-quality signal for "is this horse genuinely class enough" so we use it for the stand-out flag.
ME — Mark Edge
Today's Official Rating minus the mark the horse was rated off when it last won a handicap at this discipline. Wins in novice, maiden or conditions races don't count — they're not run under handicap conditions, so the OR the horse was carried at isn't a validated winning handicap mark. Negative = racing off a lower mark than when it last won a handicap.
| Tier | Range | Meaning |
|---|---|---|
| SOFT | ≤ −3 | Racing off a more attractive mark than its last win |
| LEVEL | −2 to +2 | Similar mark to its last win |
| HIGHER | ≥ +3 | Racing off a stiffer mark than when it last won |
★ Career-low star
Shown when today's OR equals or is below the horse's career-min OR at this discipline, and the horse has previously won a handicap at this discipline. Often a strong signal that the handicapper has given the horse a "way back in" — but only meaningful when there's a real winning mark to compare against, which is why never-won horses don't get a star.
● Combined stand-out (gold dot)
Surfaces only when SF = STRONG and ME = SOFT on the same runner. This is the headline pick: running fast lately AND racing off a soft mark.
OR sparkline — click to expand
Every row has a small inline sparkline of the horse's OR over its last 10 runs at today's discipline. Dot colours mirror inline form: green = win, blue = placed (2nd–4th), grey = other. Click any sparkline to open a larger bar chart with hover detail and pattern matching against today's conditions.
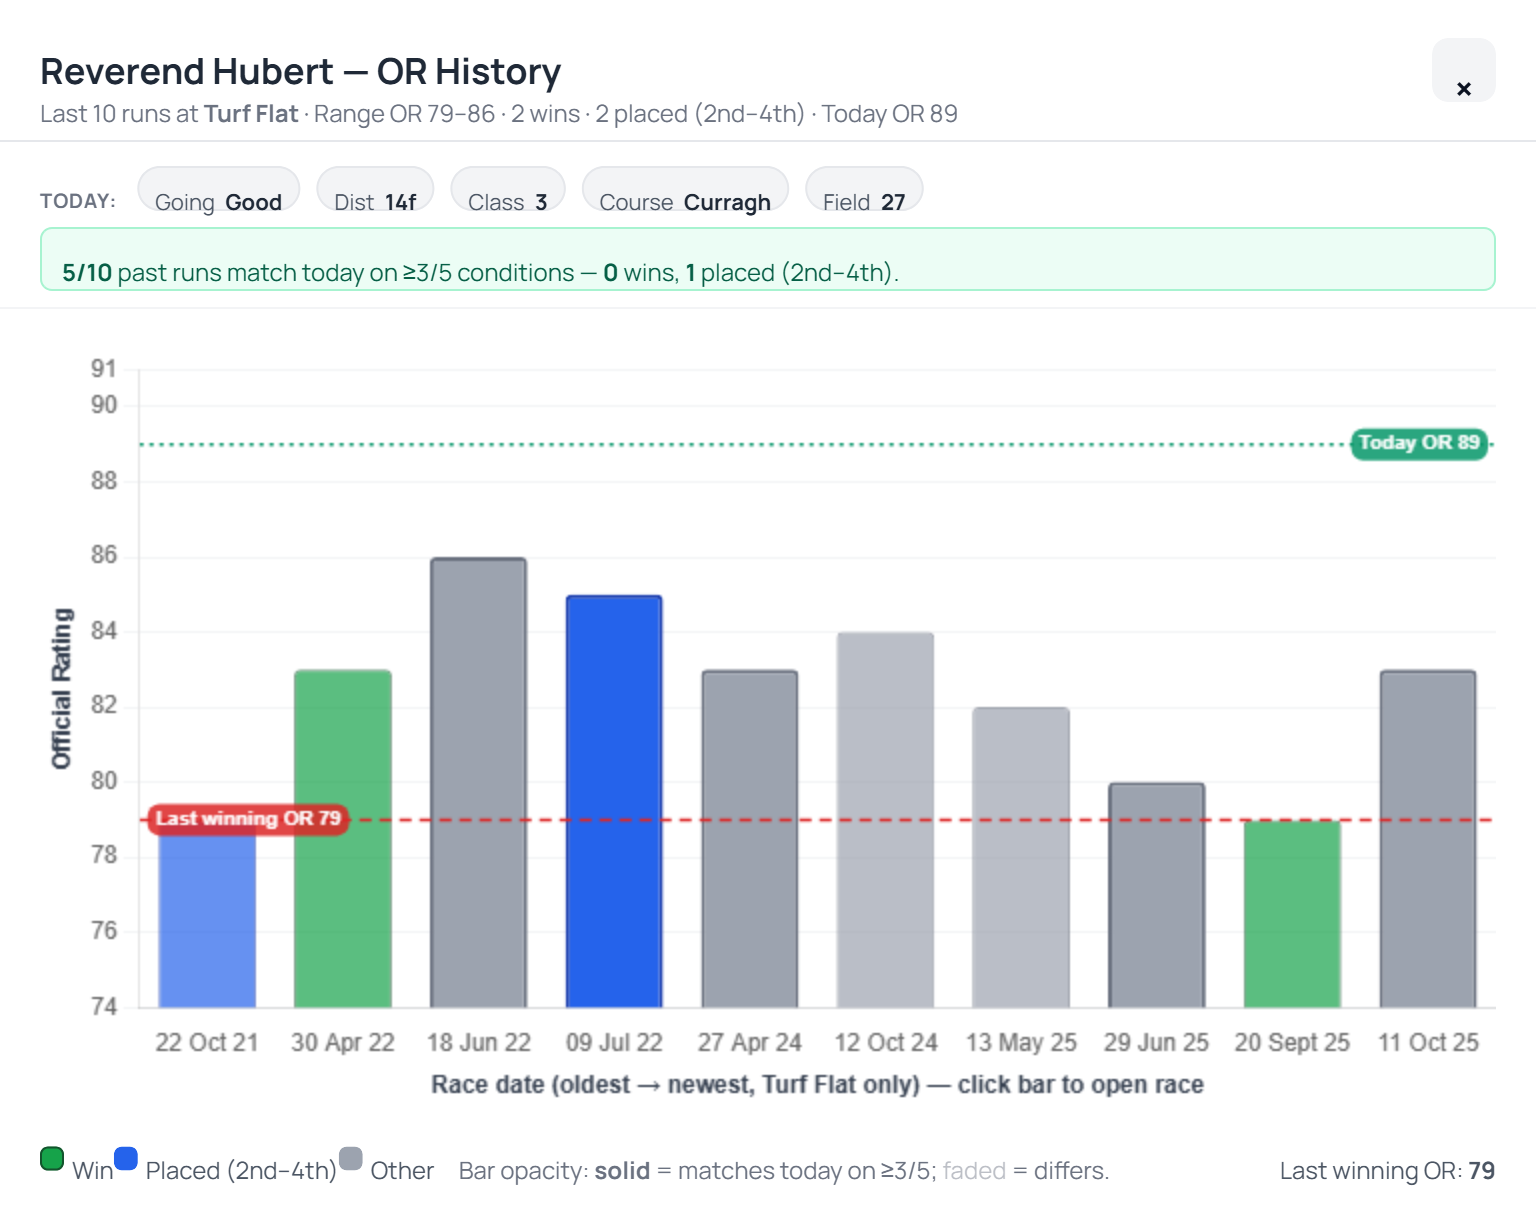
Pattern matching against today's conditions
The expanded chart compares each past run against today on five conditions: Going (within 1 firmness step), Distance (within 1 furlong), Class (within 1), Course (exact) and Field size (same band: small ≤8, medium 9–15, large 16+). Each bar gets a 0–5 match score. Bars matching ≥3/5 conditions show at full opacity with thicker borders; lower-match bars are faded so the relevant runs stand out visually.
A summary line above the chart tells you "X of N past runs match today on ≥3/5 conditions — Y wins, Z placed". Hover any bar for a 4-line tooltip with the full conditions and per-condition tick line. Click a bar to open that race in a new tab.
Draw & Pace context
The race header also pulls in the headline course-DNA + pace forecast from the Draw & Pace analysis so you don't have to switch tabs to see whether front-runners or hold-up horses are favoured today.
Worked example — Curragh 1m 6f Class 3 handicap (Good)
Race overview: 27 runners, OR spread 24 lb. The Hot/Soft Index reads SOFT 2.6/10 — wide spread, zero SF-STRONG runners, one long-handicap. Race Insights highlights 8 horses at career-low marks at this discipline.
Reverend Hubert (OR 89, top of the weights) reads as SF −1 FAIR · ME +10 HIGHER · 14 same-discipline runs. The chart unpacks why: of 10 past runs, only 4 match today on ≥3/5 conditions — and his only same-discipline win (Apr 2022 at Doncaster off OR 83) came in different conditions. The two condition-matched runs at this kind of trip + class were both unplaced. The bar chart's faded "low-match" runs visually de-emphasise the noise, so the actionable point — "today's conditions don't suit this horse historically" — pops out.
That's the discipline: you read the chips for the headline (SF / ME / ★), then click the sparkline to confirm against today's conditions.
Tab availability
- Handicap races only — the tab is greyed out for non-handicap races (Group races, novice events, conditions races, etc.)
- Enterprise tier — admins always have access; lower tiers see the tab and an upgrade modal when they click
- All history scoped to today's discipline (Turf Flat / A-W / Chase / Hurdle)
Market Movers is a dedicated racecard tab that shows the full daily price walk for every runner — Evening → Breakfast → Morning, plus BSP (Betfair Starting Price) for races that have already been run. Each price snapshot is shown three ways at once (fractional, decimal, implied probability), and three movement columns with colour bands surface who is being backed and who is drifting at a glance.
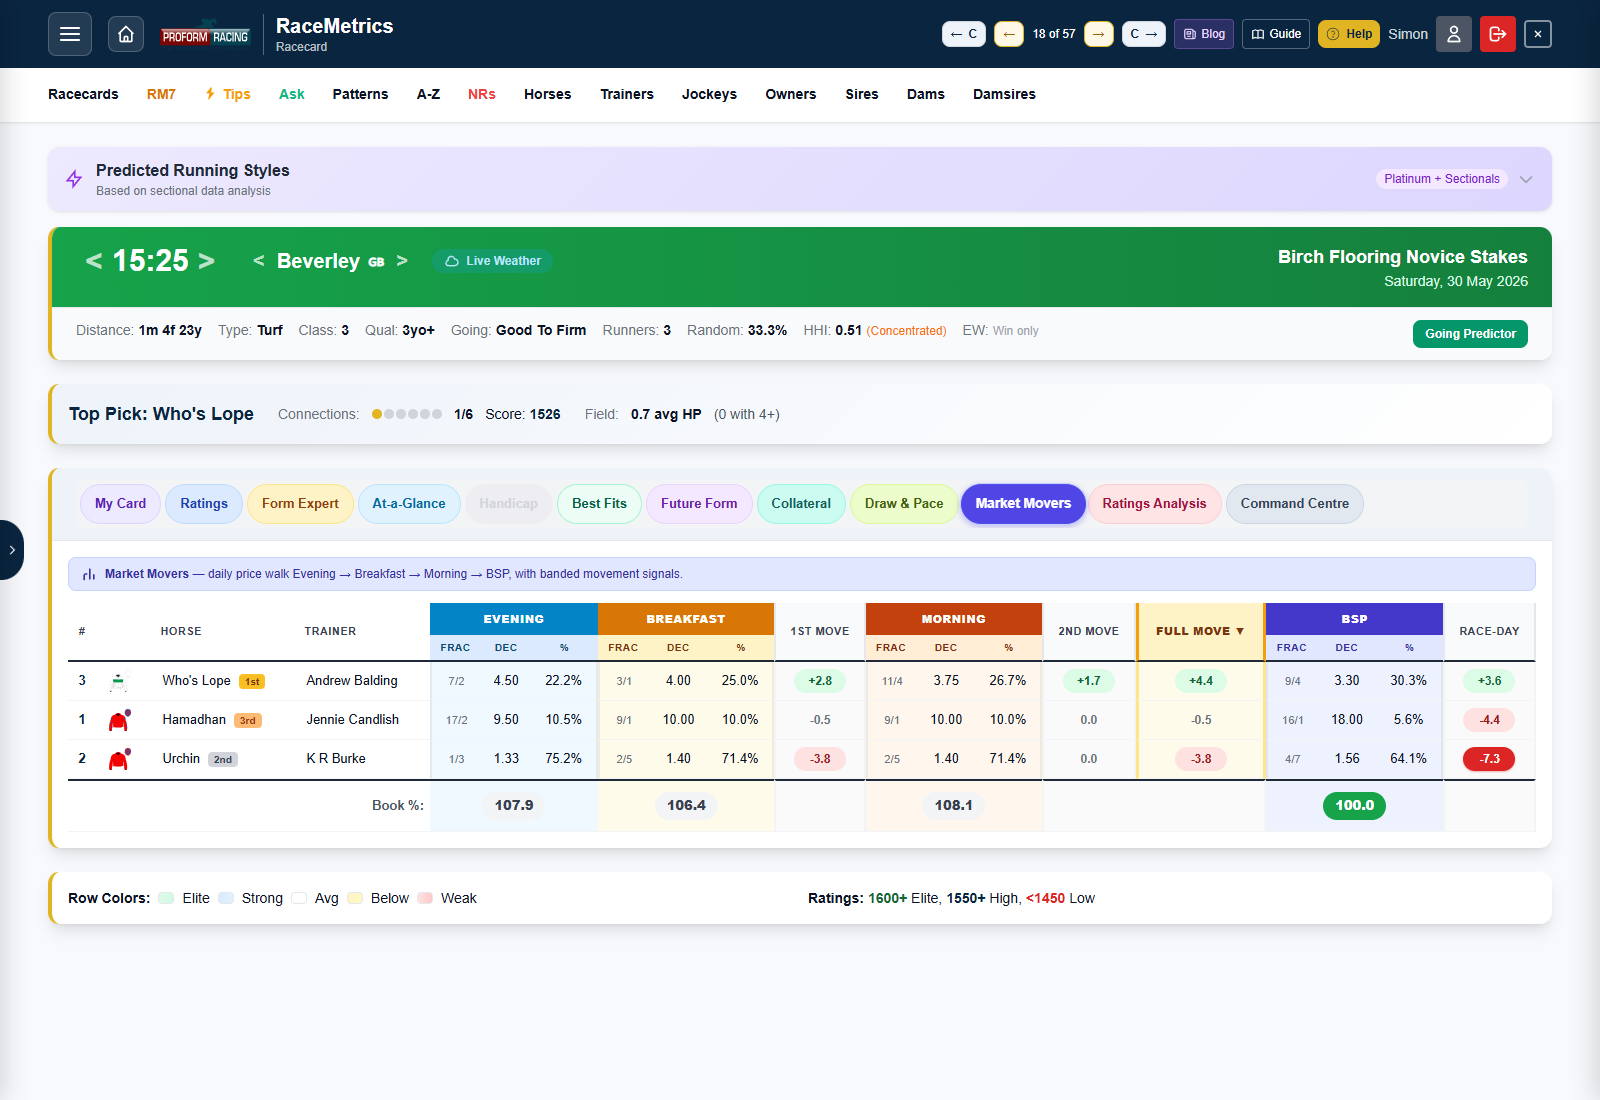
What you'll see at a glance
- Three coloured group headers across the top — Evening (sky), Breakfast (amber), Morning (sunset orange) — and a fourth (BSP, indigo) when the race has been run.
- Underneath each header, three sub-columns: Frac (the price as a bookmaker fraction, e.g. 9/4), Dec (the full decimal odds), and % (implied probability = 100 / decimal).
- Between the price blocks, narrow Move columns showing the percentage-point shift between snapshots, banded in green (steaming) or red (drifting).
- A Full Move column at the end, highlighted in amber, summarising the total shift from Evening to Morning — the headline movement signal.
- A bottom Book % footer summing each period's implied probabilities so you can see the bookies' margin tightening into off-time.
Movement bands — the colour legend
Every Move cell shows the change in implied probability in percentage points, not percent. A horse going from Evening 20% to Morning 25% has moved +5 pp, regardless of the underlying price.

| Band | Range | Meaning |
|---|---|---|
| Strong steamer | ≥ +10 pp | Heavily backed — serious money has been wagered on this horse |
| Medium steamer | +5 to +10 pp | Notable support — clearly being supported |
| Mild steamer | +1 to +5 pp | Lightly backed |
| Negligible | −1 to +1 pp | No meaningful movement — price has held firm |
| Mild drifter | −1 to −5 pp | Lightly opposed — price has eased a touch |
| Strong drifter | ≤ −5 pp | Heavily opposed — the market doesn't fancy it |
The three Move columns
- 1st Move — Breakfast % minus Evening %. The first reaction after the overnight prices were posted.
- 2nd Move — Morning % minus Breakfast %. The morning shift — often the most informative window because race-day backers and serious money come in here.
- Full Move — Morning % minus Evening %. The aggregate signal — the table defaults to sorting by this column so the biggest steamers float to the top.
When the race is over, an additional Race-day column appears showing BSP % minus Morning % — how much the price moved between the last morning snapshot and where it actually settled at off-time.
Book % footer — the overround
The bottom row sums every runner's implied probability for each period. In a perfectly fair market that total would be 100%. Bookmakers build in an overround (margin) above that, which is why most Evening books sit somewhere in the 110–125% range and tighten as off-time approaches.
| Band | Book % | Reading |
|---|---|---|
| Sharp | ≤ 105 | Very competitive market – little margin; common near the off and at BSP |
| Standard | 105 – 115 | Typical race-day bookmaker book percentage |
| Juicy | 115 – 125 | Above-average margin; common in early markets |
| Wide | > 125 | High-margin market with poor value; often seen in early prices, weaker markets, or races with greater uncertainty |
Field size matters — Margin per Runner
Same Book %, very different market. A 120% book in a 3-runner novice chase is brutal; the same 120% in a 20-runner handicap is fairly competitive. Bookmakers stack margin per runner, so bigger fields naturally accumulate more total overround.
| Runners | Book % | Reading |
|---|---|---|
| 3 | 120% | Extremely poor market |
| 8 | 120% | Quite normal early market |
| 20 | 120% | Fairly competitive market |
Underneath each Book % cell, RaceMetrics shows the Margin per Runner — the same number normalised for field size:
Margin per Runner = (Book % − 100) ÷ Runners
Reading the two numbers together gives a much sharper picture: 115% in a 5-runner novice (3.0% per runner) is expensive, but 115% in a 20-runner handicap (0.75% per runner) is sharp.
| Band | Margin/Runner | Reading |
|---|---|---|
| Sharp | ≤ 1% | Very competitive, low margin |
| Competitive | 1 – 2% | Tighter than typical |
| Standard | 2 – 3% | Normal race-day per-runner margin |
| Expensive | 3 – 4% | Wider than typical — common in small fields |
| Very expensive | > 4% | Heavy per-runner margin — usually tiny fields or weak / uncertain markets |
Where the data comes from
RaceMetrics ingests price snapshots three times a day, then settles with the official Betfair SP after the race:
| Snapshot | Imported at | Notes |
|---|---|---|
| Evening | ~ 8:32 pm the night before | Overnight bookmaker prices for tomorrow's races |
| Breakfast | ~ 7:32 am race day | First refresh of the morning |
| Morning | ~ 10:32 am race day | Final pre-race snapshot before off-time |
| BSP | After the race settles | Betfair Starting Price — the authoritative settled price |
Note: Opening odds aren't captured separately — Evening is the earliest baseline.
Sorting and reading the table
Click any column header to sort the table by that field. The default sort is Full Move ↓ so the biggest steamers of the day are at the top. Useful sort routines:
- Sort by Morning % descending to see the market's final order — effectively a "morning power rating" of public confidence.
- Sort by 1st Move to see overnight reactions — horses backed early when the smart money first sees the prices.
- Sort by 2nd Move on race day to see who's being supported in the closing window.
- On past races, sort by Race-day to see horses who moved sharply after the morning snapshot — often where late information (going changes, jockey switches) hit the market.
Tier and access
Market Movers is an Enterprise feature. Free and Basic tier users will see the tab but clicking it triggers the upgrade prompt. Enterprise, RaceMetrics Pro and Proform Premium (and admin) users get the full table on every race. All Market Movers columns are also available inside My Card for inclusion in a custom layout.
My Card is a fully customisable racecard tab. Instead of the fixed columns Ratings / Form Expert / At-a-Glance give you, you build your own layout from a library of 100+ columns sourced across every analytical tab — Main racecard, Ratings Analysis, Future Form, Draw & Pace, Trip Predictor, Predicted Running Styles, Collateral Form, Handicap and Market Movers — then drag-reorder, customise the form-line length, save the layout, and switch between layouts per race.
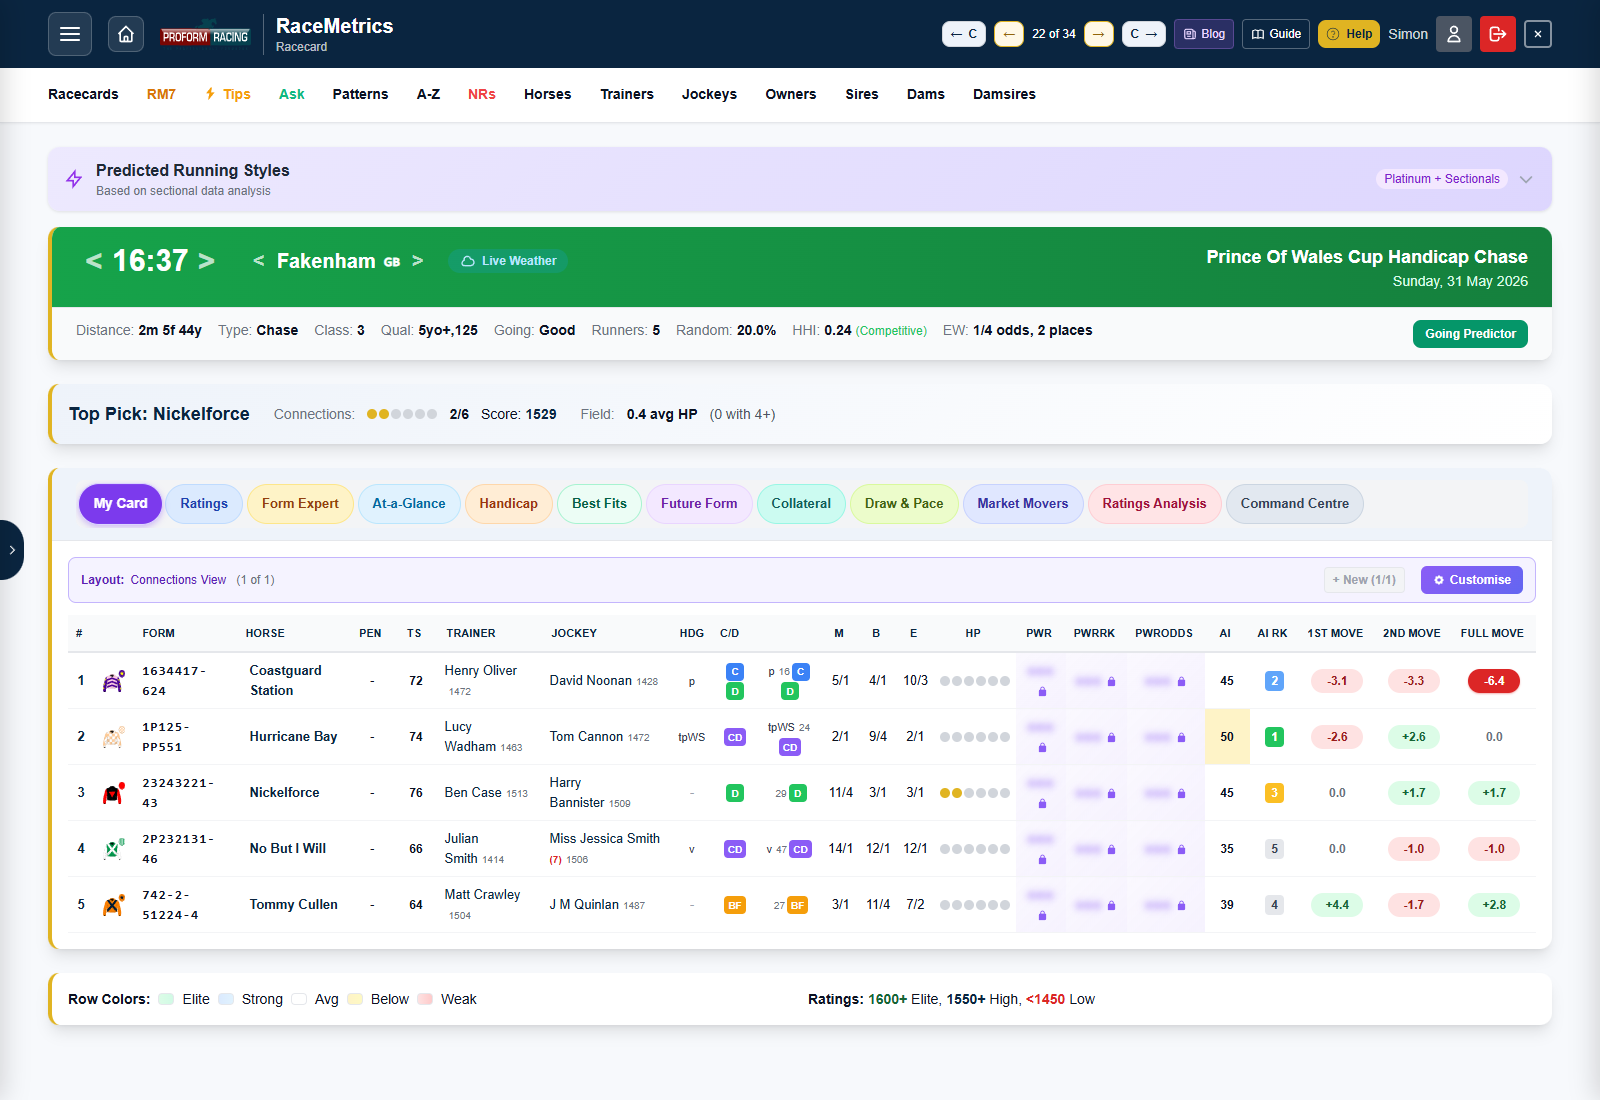
Opening the builder
From any racecard, switch to the My Card tab (first tab in the toggle bar) and click the Customise button on the layout banner. The full builder modal opens with the palette on the left and your active layout (the canvas) on the right.
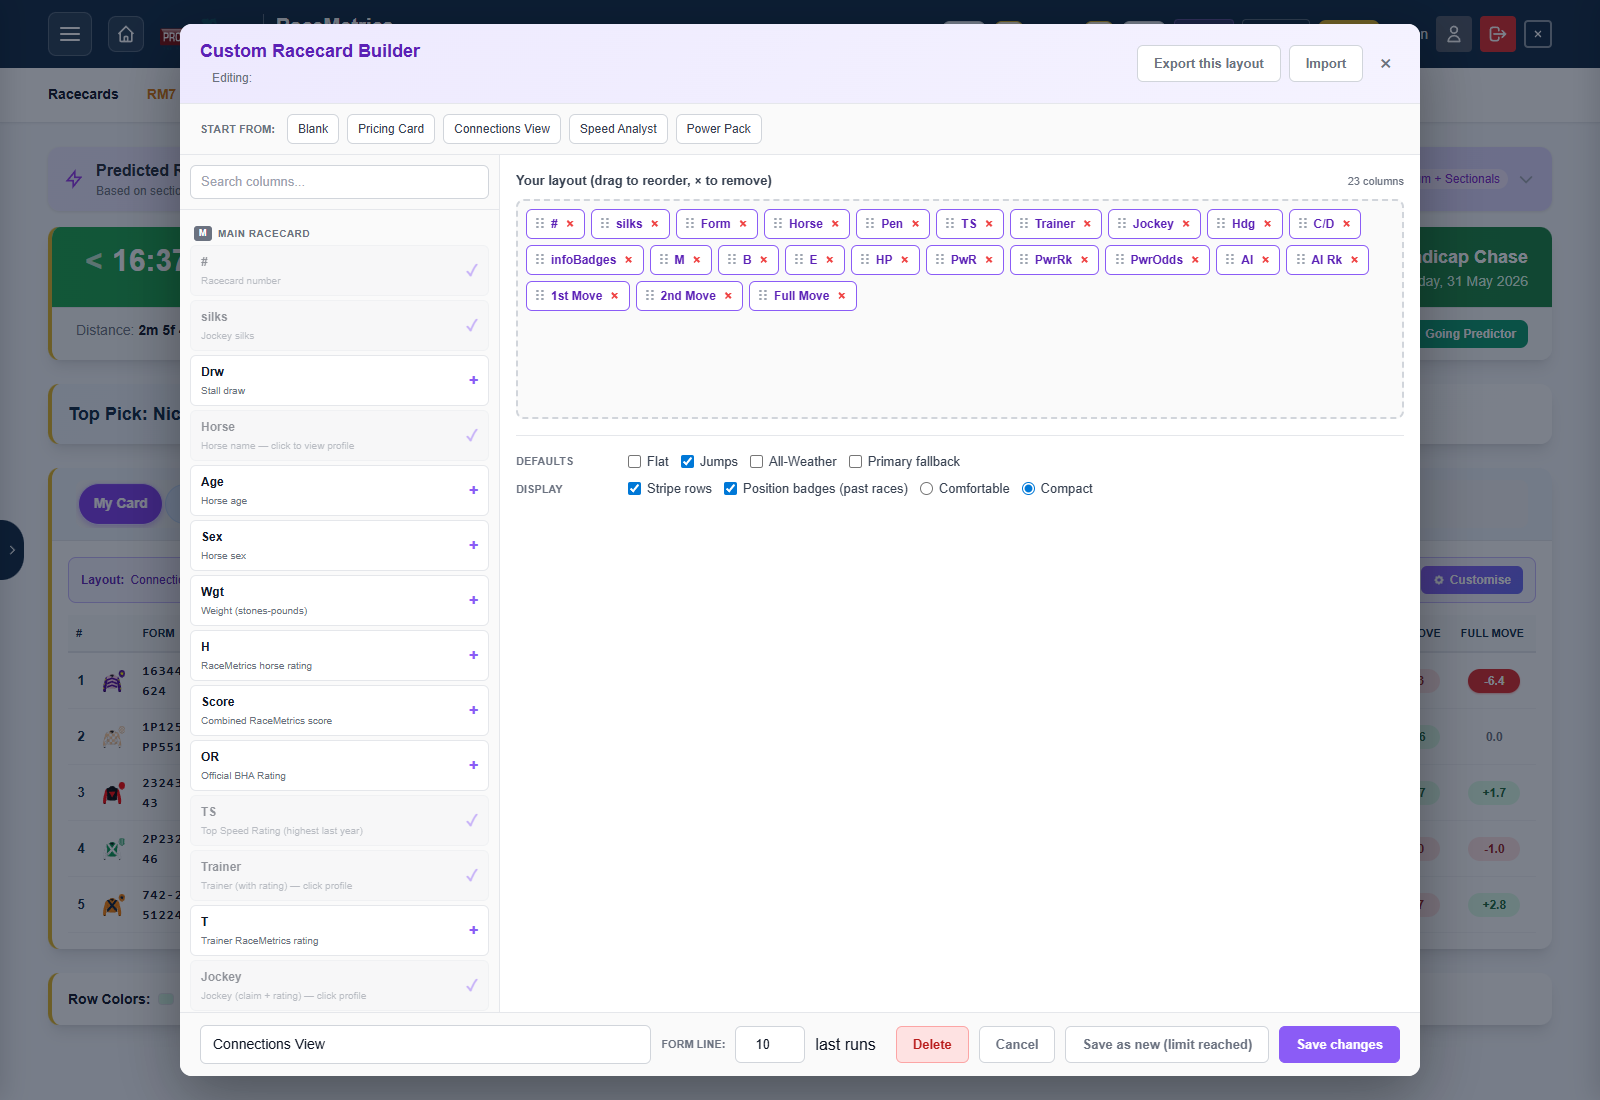
Picking columns
The palette is grouped by source — each chip in the column corner tells you where that field comes from:
| Chip | Group | What's in it |
|---|---|---|
| M | Main racecard | Card number, silks, horse, age, weight, ratings (Horse / Trainer / Jockey / Sire / Dam / Damsire / Owner), form string, prices (M / B / E), DSLR, course / distance wins, official BHA rating, top speed rating, AI Rating, AI Rank |
| RA | Ratings Analysis | 12 RaceMetrics composite ratings plus their within-race ranks: Power, Horse RA, Trainer RA, Jockey RA, Sire RA, Dam RA, Damsire RA, Owner RA, Combined RA, Future Form Score, Collateral Score, ISP / BSP / Finish for past races |
| FF | Future Form | FF Pts, sample size, opponents' PRB, opponents' win rate, opponents' best speed rating, own average PRB |
| D&P | Draw & Pace | Draw group (LOW/HIGH), Draw IV, pace style label, pace IV, tactical score, pace %s, matrix IV, Sweet/Dead zone badge |
| TP | Trip Predictor | Trip Fit (stars), trip score fraction (e.g. 2/3), trip trend, confidence level, optimal going / distance / class / surface / field size, peak age |
| PS | Predicted Running Styles | Predicted style badge (Front Runner / Prominent / Stalker / Mid-Division / Closer / Held Up), confidence, sample size, average early / late positions and percentages |
| CF | Collateral Form | Coll Advantage, Coll Disadvantage, Coll Even, Coll Net adjusted advantage, total shared data points |
| Hcp | Handicap | SF Frame chip + raw score + tier, SF All variants, ME chip + raw score + tier, Long-handicap badge, career OR range |
| MM | Market Movers | Eve / Bkf / Morn / BSP as Frac, Dec and Implied %, plus the four banded Move columns (1st / 2nd / Full / Race-day) |
Click any column in the palette to add it to your layout (the chip jumps to the canvas). Click it again to toggle it back off, or click the × on the chip in the canvas.
Reordering columns
In the canvas, drag any chip with its left-hand grip dots to reorder. The order on the canvas left-to-right is the order the columns will render in your table left-to-right. There's no theoretical limit on column count but mobile users will see horizontal scroll past about 12 columns.
Start-from presets
Four curated starter layouts sit across the top of the modal — click any to seed the canvas instantly:
- Pricing Card — ratings + form + prices, the classic compact view
- Connections View — all seven participant ratings (horse, trainer, jockey, owner, sire, dam, damsire)
- Speed Analyst — Official Rating + Top Speed + form + course / distance records + headgear
- Power Pack — the flagship cross-tab showcase — Power Rating, AI, Future Form Score, Collateral Score, Trip Fit, Predicted Style, Draw IV, Pace IV, Tactical Score
Form line length
The footer of the modal has a Form line input (1–10). My Card form strings show the horse's last N results from the data feed (which itself goes back 10). Year-break separators (the / in 234/56) are preserved when they fall inside your chosen window.
Naming, defaults and saving
Give your layout a name (e.g. "My Sprint Card") and tick any of the four Defaults checkboxes to make this the layout that auto-opens for that race type:
- Flat — turf flat races (race type 1)
- Jumps — Chase, Hurdle and NHF races (race types 3, 4, 5)
- All-Weather — AW races (race type 2)
- Primary fallback — used when none of the per-context defaults apply
Click Save changes to update the active layout in place, or Save as new to fork it into a fresh layout (auto-named "<original> (copy)" if you don't rename it).
Layout caps per tier
| Tier | Saved layouts | Behaviour |
|---|---|---|
| Enterprise | 1 | One layout slot — build the perfect one |
| Proform Premium | 10 | Build a different layout per race-type, plus a couple of experiments |
| Admin | 10 | Same as Premium |
| Below Enterprise | 0 | Tab visible but click triggers the upgrade prompt |
When you hit the cap, the + New button (in the layout banner) and the Save as new button (in the builder modal) both go disabled with a tooltip explaining the limit and an upgrade hint.
Switching between layouts
When you have more than one saved layout, the layout banner above the table shows a dropdown plus prev / next chevrons. Cycle through your layouts with the chevrons or pick directly from the dropdown. Mouse over the chevron to preview the next layout's name; the banner also shows (N of M) so you always know where you are in the rotation.
Freeze the first N columns
Wide layouts with 15+ columns scroll sideways on smaller screens. By default the identity columns at the left edge (Card #, Silks, Horse) scroll out of view as you slide the table sideways — you lose track of which row belongs to which horse. Freeze first N columns pins the leftmost N to the edge so they stay visible no matter how far right you scroll.
Open the builder, scroll to the Freeze row in the options pane, and pick 0 (off), 1, 2 or 3 columns. The frozen block gets a subtle separator line on its right edge so it reads as detached from the scrolling area. The most useful settings are 2 (Card # + Horse name) or 3 (Card # + Silks + Horse name) — whichever columns sit leftmost in your canvas are the ones that get frozen, so put your identity columns first.
Sticky header row
On long racecards (16+ runners) the column header row used to disappear off the top as you scrolled down. Now the headers stay pinned to the top of the scroll area so you can always tell which column is which without scrolling back up. No setting — on by default. Combined with the column freeze above, the top-left corner of the table holds its position against both scroll directions.
Mobile builder — three-tab view
On phones the builder collapses to a focused, full-screen three-tab layout so each pane gets the room it needs. The pill strip at the top picks the active tab:
- Add — the palette. Search and tap columns to add them to your layout.
- Layout (N) — your current layout as a vertical chip list with ◀ / ▶ reorder buttons and a × to remove. Touch-drag the handle to reorder; on an empty layout the tab surfaces the preset cards so you can start from a template.
- Settings — everything that used to crowd the footer on mobile: layout name, layout switcher, form-line length, default-for (Flat / Jumps / All-Weather / Primary), display options (stripes, badges, density), freeze first N columns, plus secondary actions (Save as new, Delete, Export this layout, Import).
The footer collapses to just Cancel and Save changes — the primary action takes the most thumb real-estate. Switching tabs has a short slide-in animation so the change of context registers. Tap + on a palette item and the Layout tab pulses briefly to confirm the chip landed.
New blank layouts open on the Layout tab with the preset cards visible; layouts that already have columns also open on Layout so you go straight to your chip list.
Premium-locked cells (blur)
A few columns are gated to Proform Premium even within My Card — specifically the three Power Rating columns (PwR, PwrRk, PwrOdds) and Predicted Running Style fields. Enterprise users without Premium can still add those columns to a layout, but the cells render as blurred ••• placeholders with a tooltip and click-to-upgrade prompt. Layouts therefore stay shareable across tiers — export a layout containing Premium fields and import it as an Enterprise user; the Premium fields simply lock until they upgrade.
Import & Export
The builder header has Export this layout and Import buttons. Export downloads a JSON file containing the currently-edited layout only (filename includes the layout name slug + today's date). Import accepts the same JSON shape — useful for sharing layouts between users, backing up before a re-shuffle, or experimenting with a copy.
Inline form lines
Just like the Ratings and At-a-Glance tabs, clicking any horse row in My Card expands an inline form-line block underneath showing the runner's last 6 races with full per-race detail. Click again to collapse.
Printing your card
Your layout isn't just for the screen — you can put it on paper, or save it as a colour PDF, for a single race or a whole day's racing. On the My Card tab, click the Print button on the layout banner (right next to Customise). A modal opens with everything you need:
- Date — defaults to the day of the race you have open; switch it to any other day with upcoming races (past days can't be printed yet).
- Race picker — every meeting for that day, with a tick-box per race and a select-all tick-box per meeting. Tick just the open race for a one-race print, or sweep whole meetings for a full-day card (up to 40 races per print).
- Form lines per runner — None, 1, 2, 3, 5 or 10. Each runner's last N form lines print underneath the race table, in card order.
- Form or Sectional view — pick which form-line style prints. The sectional view includes the ROS (Run Out Speed) column and needs the Sectionals add-on.
Click Open print view and every selected race renders with your active layout on a print-optimised page, then the browser's print dialog opens automatically — pre-set to A4 landscape, small margins and full colour. Want a file rather than paper? Choose Save as PDF as the destination in that same dialog and you get a colour PDF of the identical pages.
A few things the print view handles for you:
- One race per page — each selected race starts on a fresh sheet.
- Wide layouts auto-shrink to fit the page width. A very wide layout shows an on-screen warning suggesting you trim a few columns before printing — the warning itself never prints.
- Locked columns are dropped — any column your subscription can't see is left out of the print entirely rather than appearing blurred.
Printing is part of the Enterprise plan, so Enterprise and Proform Premium subscribers both have it. The Sectional form-line view additionally needs the Sectionals add-on — without it the option is shown but stays disabled.
Tier and access
My Card is an Enterprise feature. The tab button is visible to everyone but clicking it as a non-Enterprise user shows the inline upgrade card with a View Plans button (same pattern as Best Fits and Handicap). The Customise button and saved layouts are gated server-side as well.
What is the Weather Centre?
The Weather Centre provides live weather conditions for every UK and Irish racecourse, including satellite course maps, real-time wind speed and direction, temperature, and a 7-day rainfall history chart. Use it to assess ground conditions before racing.
Key Features
- Satellite Course Map — aerial imagery of the racecourse with an animated wind direction arrow showing which way the wind is blowing and its speed
- Current Conditions — temperature, wind speed with gusts, compass direction, and a weather description (clear, overcast, rain, etc.)
- 7-Day Rainfall Chart — bar chart showing daily precipitation totals for the past week plus today, with a cumulative total. Essential for judging how the ground will ride
- Race Day Rain — today's precipitation highlighted so you can quickly see how much rain has fallen at the course
- Course Maps — Proform's detailed track layout maps showing distances, elevation profiles, and course characteristics for both Flat and Jumps configurations
Accessing the Weather Centre
- Racecards menu: Choose Weather Centre from the Racecards menu in the navigation bar
- Racecard: Click the Live Weather button in the race header (next to the course navigation arrows)
- Direct URL:
weather.html?courseId=14(pre-selects a specific course)
Upcoming Fixtures
The sidebar shows courses with racing scheduled for the next 3 days, grouped by date with Today, Tomorrow, and future day headers. Click any course to instantly view its weather and satellite map.
Any Course Lookup
Use the Any Course dropdown at the top of the sidebar to look up weather for any of the 78 UK, Irish, and international racecourses — even weeks in advance of a meeting.
Wind Direction
The wind arrow overlay on the satellite map shows the direction the wind is blowing towards (not where it comes from). The arrow colour indicates wind speed:
- Blue — Light wind (under 15 mph)
- Amber — Moderate wind (15–30 mph)
- Red — Strong wind (over 30 mph)
Data Source
Weather data is provided by Open-Meteo and updates every 15 minutes. Course maps are from Proform Racecourse Profiles. Satellite imagery is provided by Esri.
Availability: The Weather Centre is free for all users on every subscription tier.
What is the Command Centre?
The Command Centre is an interactive performance heatmap available on all profile pages — trainers, jockeys, horses, sires, dams, damsires, and owners. It visualises performance across two dimensions simultaneously (e.g., Course × Month) using colours calibrated to each participant’s own benchmark, letting you spot targeting patterns, seasonal sweet spots, and profitable niches at a glance.
How to Access
There are two ways to open the Command Centre:
- From any profile page: Click the Command Centre tab (marked with a purple PP badge)
- From any racecard: Click the Command Centre button in the view tab bar (after Collateral). A dropdown lets you choose which participant type to analyse — Horse, Trainer, Jockey, Sire, Dam, Damsire, or Owner. The profile opens directly to the Command Centre tab with the race context navigator active, so you can switch between participants in the same race
Benchmark Coloring
Rather than using fixed colour scales, the Command Centre calculates each participant’s own overall metric value as the benchmark. For example, if a trainer has a 22.9% win rate across all filtered runs:
- Green cells — above the participant’s benchmark (better than their average)
- Yellow cells — at the benchmark (typical for this participant)
- Red cells — below the benchmark (worse than their average)
The current benchmark value is displayed as an amber badge in the summary bar (e.g., Benchmark: 22.9%). This means you are always comparing a participant against themselves, not against a global average — essential because different participants have very different baseline performance levels.
Visualization Controls
- X Axis / Y Axis: Choose any two different dimensions — Course, Month, Year, Class, Going, Race Type, Distance, or Day of Week
- Metric: What the cell colour represents — PRB % (default), Win %, Place %, ROI %, or Runs
- Min Runs: Minimum sample size per cell. Default is 3 for most participants, 1 for horses (which have fewer career runs)
- 3D / 2D Toggle: Switch between an interactive 3D bar chart and a flat 2D heatmap
Data Filters
The Command Centre has its own independent filter controls, separate from the profile-level filters:
- Race Type: All, Flat, Jumps, Turf, A/W, Chase, Hurdle, NHF
- Handicap: All, Handicap only, Non-Handicap only
- Class: All or a specific class (1–7)
- Going: All or a specific going condition
- Period: All Time, 5 Years, 2 Years, 1 Year
- Age: All, 2yo, 3yo, 4yo, 5+
Cell Drill-Down
In the 2D heatmap view, click any cell to open a detailed drill-down modal showing:
- Summary statistics: Runs, Wins, Win%, PRB, P/L, and ROI for that specific cell
- Individual runs table: Every race that makes up that cell — date, course, horse, finishing position, field size, BSP, P/L, and rating change. Horse names are clickable links to their profiles
- Save as Pattern: Save the cell as a pattern directly from the modal (see below)
Save as Pattern
From the cell drill-down modal, you can save any cell as a betting pattern. The pattern name is pre-filled (e.g., “John Gosden: Ascot × October”) and can be edited before saving. The pattern conditions are automatically built from:
- The cell’s X and Y dimension values (e.g., course = Ascot, month = October)
- Any active Command Centre filters (e.g., Handicap only, Class 2)
Saved patterns appear in the Pattern Manager and will trigger alerts when matching runners appear in future racecards.
Hover Tooltips
Hovering over any cell shows a detailed tooltip with: Runs, Wins, Win%, Place%, PRB, ROI, and P/L — giving you a complete picture without needing to click.
3D View
An interactive 3D bar chart where each bar represents a unique combination of the X and Y dimensions. Bar height shows the metric value, and colours follow the same benchmark-relative scale. Click and drag to rotate, scroll to zoom.
Top Cells Table
Below the chart, a ranked table shows the top 20 cells sorted by the selected metric. Columns include both dimension labels, Runs, Wins, Win%, PRB, P/L, ROI, and the metric value. The top row is highlighted in gold.
Example Use Cases
- Course × Month: See where a trainer targets runners by time of year
- Going × Class: Discover which ground/class combinations a trainer excels at relative to their own benchmark
- Distance × Race Type: Spot trip preferences across flat and jumps
- Course × Class (Handicap filter): Find profitable handicap angles at specific courses and class levels
- Sire × Going: See how a sire’s progeny perform on different ground conditions
Settings Persistence
Your axis selections, metric choice, minimum runs, view mode (3D/2D), and filter settings are all saved to your browser and persist across tab switches and page reloads.
What is Ratings Analysis?
Build your own composite rating from 12 source ratings, save it as a named system, backtest it over thousands of historical races, and export past qualifiers as CSV for import into ProForm. This is the beginning of the web-era equivalent of the Proforms system builder, fully integrated with RaceMetrics’ live data.
The twelve source ratings are Power, the seven RaceMetrics ratings (Horse, Trainer, Jockey, Sire, Dam, Damsire, Owner), Combined Score, AI Rating, Future Form and Collateral — each stored alongside the runner’s within-race rank. Weight them however you like to produce your own composite score, filter the field with per-rating thresholds and race / runner conditions, and save your favourite setups as named systems to pull up on any race. The exported CSV drops straight into Proform as a User Rating, ready for the full Proform System Builder.
Where to find it
Open any race → click the Ratings Analysis tab at the top of the racecard popup (alongside Ratings, Form Expert, Future Form etc.).
Key features
- 12-rating combine bar — one weight slider per rating, in two rows. Sliders use z-score normalisation so you can mix any ratings regardless of scale.
- Saved systems — name and reuse any weight + filter setup across every race.
- Filters — per-rating thresholds (Top N rank, min value, clear-by margin), runner conditions (age, draw, DSLR, headgear, price range), race conditions (class, distance, field size, going, race type, handicap).
- Backtest — date range + price field (BSP / ISP / Morning / Breakfast / Evening), Weighted or Top-rating selection mode (tie-aware), group breakdowns by year / class / course / distance / going / race type.
- Forward Qualifiers — the same system applied to upcoming races, so today’s and tomorrow’s selections fall out automatically.
- Configurable CSV export — the five core columns are always exported (ProForm User Rating compatible), and you can tick extras for rating values, ranks, runner context, prices and settlement data.
- Proform User Rating import — the exported CSV lands directly into one of Proform’s six User Rating slots so the full Proform System Builder can be pointed at your RaceMetrics-built score.
Full guide on Proform
For the complete walk-through — screenshots of the matrix, the slider bar, the filter panel, backtest results, the column picker, and the Proform User Rating import workflow — see the full help article on Proform:
Open the full Ratings Analysis guide →
Availability: Ratings Analysis is part of RaceMetrics Pro (and Proform Premium). Free, Basic and Enterprise tiers will see an upgrade prompt when they click the tab.
The Pattern Manager lets you save profitable angles you discover and receive automatic alerts when conditions match on upcoming racecards.
Stats Summary
Four cards at the top provide an overview of your saved patterns:
- Total: Number of patterns saved
- Active: Number of patterns currently enabled
- Avg ROI: Average return on investment across all patterns
- Types: Number of different participant types in your patterns
Creating Patterns
Patterns are created from profile pages. When you identify a profitable angle (e.g., a trainer performs well at certain courses), click "Save Current View as Pattern". The pattern captures your current filter settings as matching conditions.
Pattern Conditions
Patterns automatically capture whatever filters were active when you saved, which may include:
- Specific trainer, jockey, sire, dam, damsire, owner, or horse
- Course or course type
- Distance range
- Race class or type
- Going conditions
- Price range (odds)
Filtering & Sorting Patterns
The Pattern Manager provides controls to organise your saved patterns:
- Type Filter: Show only patterns for a specific profile type (Trainers, Jockeys, Sires, etc.)
- Status Filter: Show All, Active only, or Inactive only
- Sort By: Newest first, Best ROI, Most Runs, or Alphabetical (A-Z)
Pattern Cards
Each saved pattern shows:
- Participant name and type badge
- Conditions: The filters that define the pattern
- Stats: Runs, Wins, Strike Rate (SR), P/L, and ROI since saved
- Active Toggle: Enable/disable without deleting
- Actions: View Profile or Delete
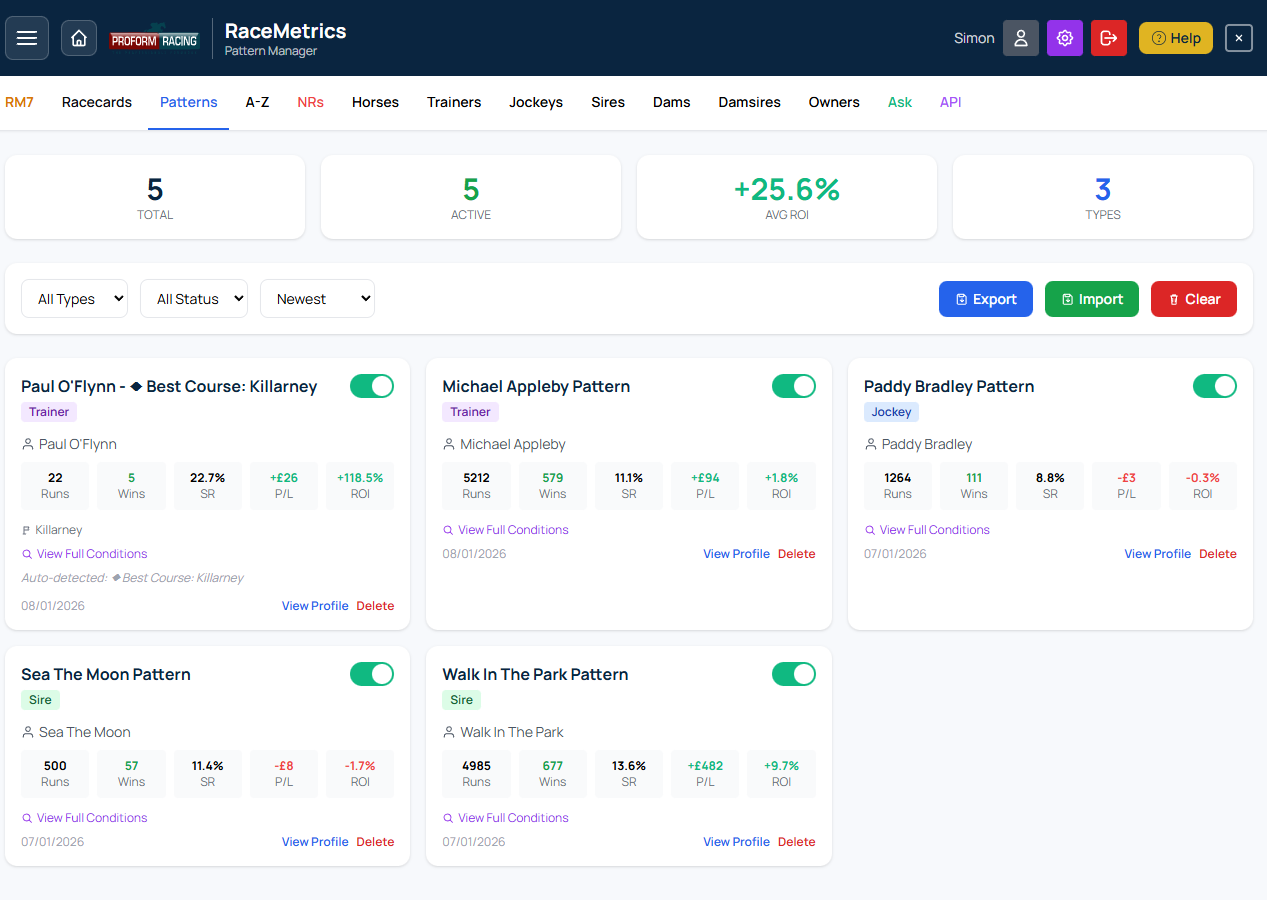
Pattern Manager showing saved patterns with stats, active toggle, and filter controls
Export & Import
- Export: Download all patterns as a JSON file for backup or sharing
- Import: Restore patterns from a JSON file (choose to merge or replace)
- Clear All: Delete all patterns (use with caution)
Pattern Alerts on Racecards
When your active patterns match runners on today's racecards, they appear as purple badges. Click a badge to expand and see the full pattern details including historical stats and P/L.
Pattern Limits
The number of patterns you can save depends on your subscription tier:
- Free: 5 patterns
- Basic: 10 patterns
- RaceMetrics Pro: 1000 patterns
- Expert: 250 patterns
- Enterprise: 1,000 patterns
RaceMetrics 7 (RM7) is our free weekly skill-based competition where you pick 7 racing participants and compete for cash prizes based on performance ranking changes.
How It Works
- Pick Your Team: Select any combination of 7 participants (horses, trainers, jockeys, sires, dams, damsires, or owners) within the budget limit
- Track Performance: Your selections earn points based on how their RaceMetrics ratings change during the week (Tuesday to Sunday)
- Climb the Leaderboard: Compete against other users for the top spots
Scoring
Points are awarded based on rating changes:
- When your selections' ratings increase, you gain points
- When ratings decrease, you lose points
- The goal is to pick participants who will improve their ratings during the week
Budget System
Each participant has a "price" based on their current rating. Higher-rated participants cost more, creating strategic decisions between picking proven performers vs value selections.
Weekly Prizes
The top three finishers win cash prizes, paid by bank transfer. The prize fund is set per competition and can vary from week to week — the current week's amounts are shown on the RM7 competition page.
Entry
RM7 is completely free to enter for all registered users - no purchase or subscription required. New competitions start each Tuesday.
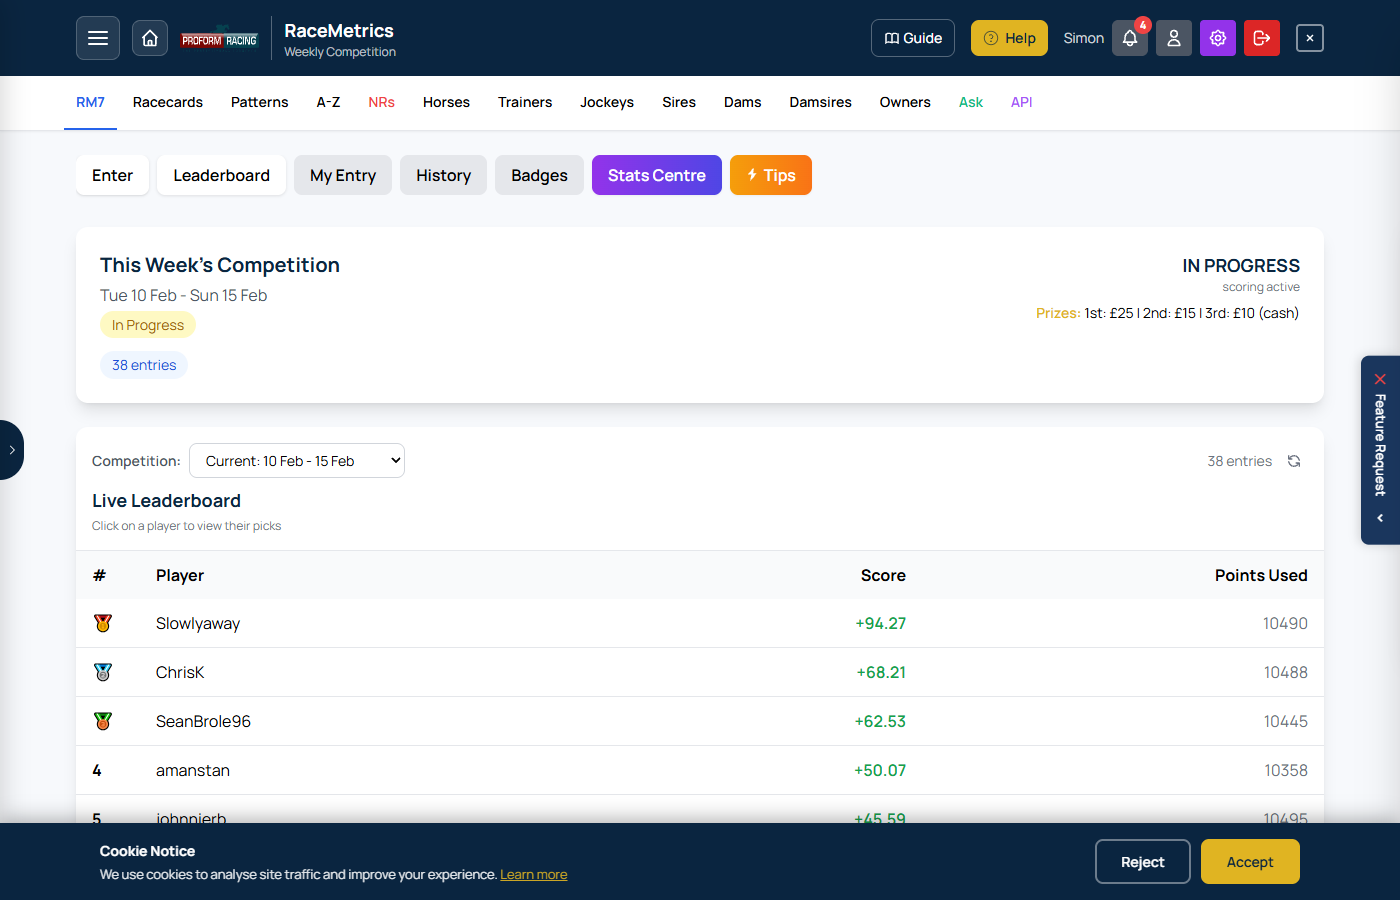
RM7 Competition leaderboard showing weekly rankings, cumulative scores, and participant selections
The Stats Centre tab on the RM7 Competition page provides analysis tools to help inform your selections. Access it via the "Stats Centre" tab when viewing an active competition.
Dashboard
Shows the top movers by rating change over the last 7 days. Use the toggle to switch between:
- In Form: Participants with the biggest rating gains
- Out of Form: Participants with the biggest rating drops
The Agent
Shows the optimal 7 picks that would have fit within the 10,500 budget based on the last 7 days of performance. Uses a greedy algorithm to maximise total gain while staying within budget.
Tip: Check on Monday from 10am to see what the optimal picks would have been for the previous week's competition.
Compare
Side-by-side comparison of any two participants of the same type. Search and select participants to compare their:
- Current ratings and recent changes
- Performance history
- Recent form
Essentials
Shows the most active participants by runner count over the last 7 days. Useful for identifying participants with the most opportunities to change their rating.
Most Picked
Shows the most popular selections made by other users in the current competition. See which participants the community is backing.
The Non-Runners (NRs) page shows horses that have been withdrawn from today's racing, updated throughout the day.
Summary Cards
- Non-Runners: Total withdrawn horses for the day
- Abandoned: Number of meetings called off
- Courses: Number of affected courses
- Updated: Time of last data refresh
Display Format
Non-runners are grouped by course with race times shown. Each entry displays:
- Race time
- Horse silks (colours)
- Horse name (click to view profile)
Multiple non-runners in the same race appear on the same row.
Refresh Button
Click Refresh in the header to manually check for new non-runners throughout the day.
Why Track Non-Runners?
- Identify patterns in trainer withdrawals
- Spot horses being held back for specific conditions
- Stay informed about market-moving withdrawals
- Plan bets around withdrawn fancied horses
Ask RaceMetrics (AI)
Ask RaceMetrics lets you query the entire Proform Racing database using plain English. An AI engine translates your question into a database query and returns the results instantly.
Accessing Ask RaceMetrics
- Open the System Builder menu in the navigation bar and choose Ask RaceMetrics
Ways to Query
- Type a question: Ask anything in natural language, e.g. "Top 10 trainers by strike rate at Cheltenham this year"
- Query Recipes: Choose from 10 recipe types below the input box to build a precise query without typing — see the full Recipe Guide below
- Voice input: Click the microphone icon to dictate your question (Chrome/Edge)
Keyword Guide
The Keyword Guide shows every word the system recognises. Click any keyword to insert it into your query. Browse categories like Time Periods, Race Types, Going, and more.
Slash Commands
Type / in the input box to see available commands. These give you instant reference information without using a query:
/help— Quick usage guide/fields— Browse all queryable data fields/groupby— See all ways to group/present results/filters— View all filter keywords the AI understands/examples— Clickable example queries/tips— Tips for writing better queries/history— Open your query history
What You Can Ask About
- Trainers, Jockeys, Horses: Strike rates, records, P/L, trends
- Sires, Dams, Damsires: Progeny statistics, going preferences
- Courses & Festivals: Track records, festival stats (Cheltenham, Ascot, etc.)
- Power Ratings: Proform power rating figures, ranks, forecast odds
- Speed Figures: Speed ratings, LTO ratings, historical comparisons
- Pace Data: Pace ratings, running style analysis
- RaceMetrics Ratings: Elo ratings, rating changes, biggest movers
- Market Data: Starting prices, Betfair SP, forecast prices
Viewing Results
- Table view: Sortable columns (click headers), participant names link to profiles
- Chart view: Bar, Stacked Bar, Line, Pie, Polar Area, Horizontal Bar
- Export: Download as CSV or chart as PNG
Query Limits
Each subscription tier has a daily query allowance. Your remaining queries are shown below the input box. Queries reset at midnight.
Tips for Better Results
- Be specific with time periods: "this year", "last 30 days", "from April 2025"
- Name your metric: "strike rate", "P/L", "ROI", "level stakes profit"
- Set minimum runs: "with at least 10 runners"
- Use "by" for grouping: "by trainer", "by going", "by course"
- Combine filters naturally: "handicap hurdles on soft ground this year"
- Use custom date ranges: "from 1st April 2025 to 30th October 2025"
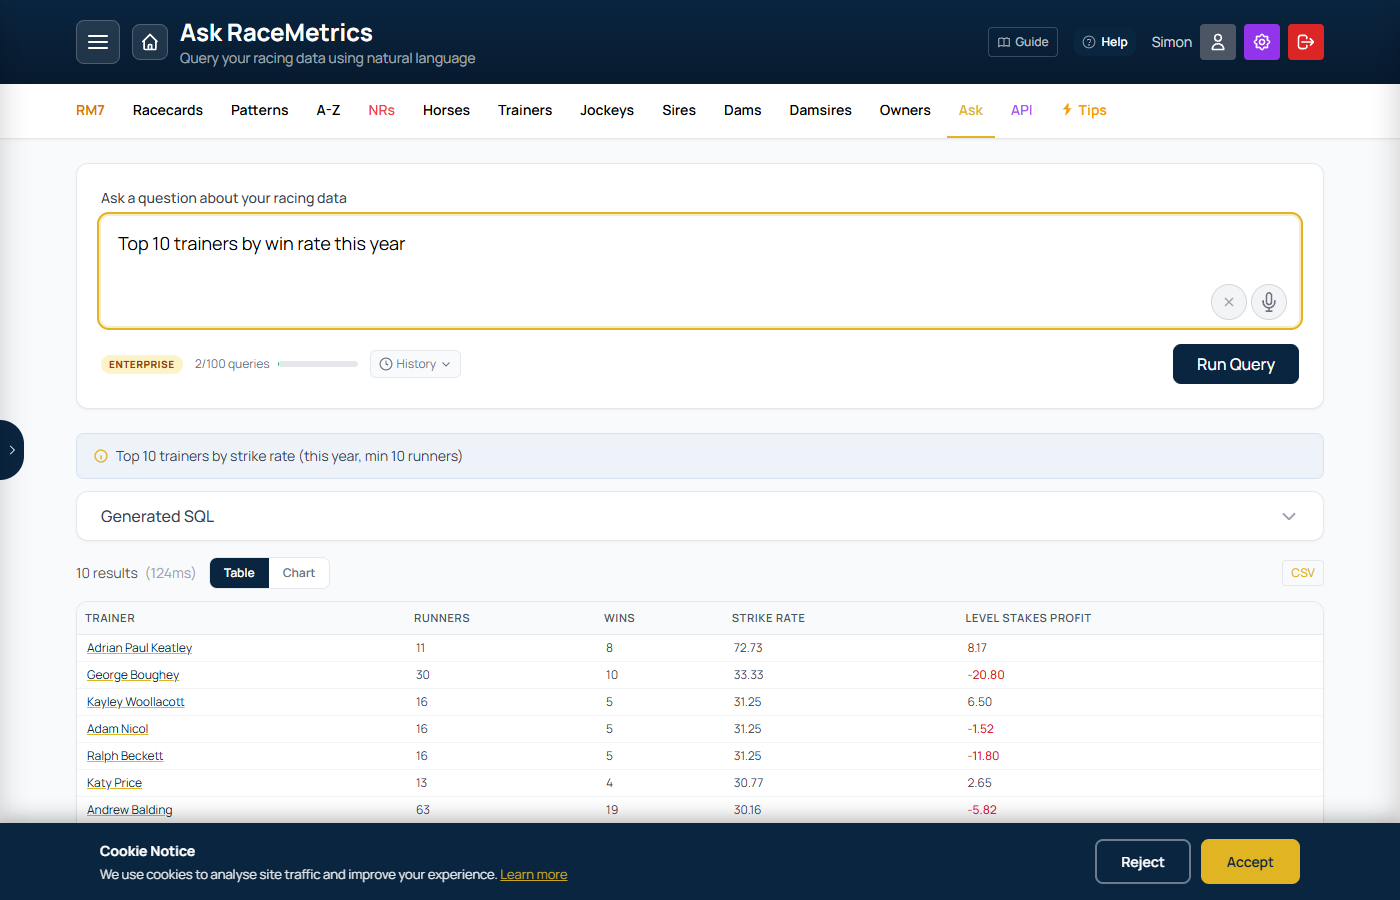
Ask RaceMetrics showing a natural language query with results table, featuring the query input box and AI-generated response
Query Recipes are a visual query builder that appears below the input box on the Ask RaceMetrics page. Instead of typing a question from scratch, you pick a recipe, fill in the options, and the system builds a precise natural language query for you automatically.
There are 11 recipes available, each targeting a different type of analysis. Click a recipe card to expand it, adjust the options, then click Run to execute the query.
How recipes work: Each recipe generates a sentence in plain English (shown in the preview area). That sentence is submitted to the AI exactly as if you had typed it yourself — so you can also edit it before running if you want to fine-tune.
1. Leaderboard
Top performers ranked by a chosen metric
Find the best-performing trainers, jockeys, sires, or owners over any time period, ranked by strike rate, profit, or wins. Set a minimum runner threshold to filter out small samples.
| Option | Choices |
|---|---|
| Show Top | 5, 10, 20, 50 |
| Participant | Trainer, Jockey, Sire, Owner |
| Ranked By | Strike Rate, Level Stakes Profit, Wins |
| Min Runners | 3, 5, 10, 20, 50 |
Filters available: Time Period, Race Type, Classification, Going, Runner type, Festival
Example output: "Top 10 trainers by strike rate with at least 10 runners in handicap hurdles on soft ground this year"
2. Record Lookup
Full stats for a specific name
Look up the historical record of any named trainer, jockey, horse, sire, dam, damsire, or owner. Type the name and optionally specify the participant type — or leave it on Auto-detect and the system will identify the correct type.
| Option | Choices |
|---|---|
| Name | Free text (e.g. "Paul Nicholls", "Frankel", "Ryan Moore") |
| Type | Auto-detect, Trainer, Jockey, Horse, Sire, Dam, Dam Sire, Owner |
Filters available: Time Period, Race Type, Classification, Going, Festival
Example output: "Paul Nicholls's record as a trainer in chases last year"
3. Today's Angles
Interesting runners on today's cards
Quickly surface runners that match a specific angle on today's (or tomorrow's) cards. Choose from a wide range of preset conditions covering form, headgear, class, market moves, ratings, and connections. You can also filter by a specific course.
| Condition | What it finds |
|---|---|
| First time headgear | Horses wearing headgear for the first time |
| First time blinkers | Horses wearing blinkers for the first time |
| First time cheekpieces | Horses wearing cheekpieces for the first time |
| Dropping in class | Horses stepping down in class from their last run |
| Won last time out | Horses that won their previous race |
| Won last two races | Back-to-back winners with consecutive victories |
| Beaten fav last time | Horses that were beaten as favourite in their last race |
| Making debut | First-time runners making their racecourse debut |
| Unbeaten runners | Horses with a 100% win record from at least one run |
| Off a break (90+ days) | Horses returning after 90 or more days off |
| Proven off a break (50+ days) | Horses off 50+ days that previously won or placed off a similar break |
| Placed last 3 runs | Horses that placed in each of their last 3 runs — consistent form |
| Won or placed last 3 runs | Horses that won or placed in each of their last 3 runs |
| Quick turnaround (7 days or less) | Horses running within 7 days of their last race |
| Course winners | Horses that have won at today's course before |
| C&D winners | Horses that have won at the course and distance |
| Stepped up in class | Horses running in a higher class than their last race |
| First time in handicap | Horses making their handicap debut |
| Career-best OR needed | Handicappers that need a career-best official rating to win |
| Carrying a penalty | Horses carrying a weight penalty |
| Gelded since last run | Horses that have been gelded since their last race |
| Market drifters | Horses whose price has drifted since the evening |
| Top score + top horse rating | Runners ranked first for both combined score and individual horse rating |
| Stable first strings | Trainers' top-rated runners when they have multiple entries |
| Stable second strings | Second-string runners from multi-entry trainers |
| Jockey with one ride | Jockeys who have only one booked ride today |
| Top power rated horses | Runners with the highest Proform power rating in their race |
| OR raised (not won LTO) | Horses given a higher official rating despite not winning last time |
| Sectional upgrades 7lb+ | Horses whose sectional analysis suggests 7lb+ improvement potential |
| Longest travellers | Horses that have travelled the furthest distance to race today |
| Hot T/J combos with runners | Trainer/jockey partnerships with strong recent strike rates |
| Best course for favourites | Courses where market leaders have historically performed best |
| Rating movers (14 days) | Horses whose RaceMetrics rating has moved significantly in the past 14 days |
Optional filter: Limit results to a specific course from the full UK/Irish course list
4. In-Form (Trend)
Who is on a hot streak right now
Find trainers or jockeys who are currently in form based on a minimum number of winners over a recent time window. Useful for identifying professionals to follow or avoid on any given day.
| Option | Choices |
|---|---|
| Participant | Trainer, Jockey |
| Min Winners | 2, 3, 5, 10 |
| Period | Last 7 days, Last 14 days, Last 30 days, Last 3 months |
Filters available: Race Type, Going
Example output: "Trainers with 3+ winners in the last 14 days on flat turf"
5. Course Stats
Stats at a specific racecourse
Analyse performance at a single course. Choose any of the 81 UK and Irish racecourses and rank trainers, jockeys, sires, owners, or draw positions by your chosen metric. When Draw is selected, a distance filter appears so you can analyse draw bias over specific trip lengths.
| Option | Choices |
|---|---|
| Course | All 81 UK & Irish courses (Aintree, Ascot, Cheltenham, Chelmsford City, Dundalk … York) |
| Analyse By | Trainer, Jockey, Sire, Owner, Draw |
| Metric | Strike Rate, Level Stakes Profit, Wins |
| Distance (Draw only) | Dynamically loaded distances that have been run at the selected course |
Filters available: Time Period, Race Type, Going
Example outputs: "Top jockeys at Cheltenham by strike rate last 5 years" • "Draw stats at Chester over 5f-6f"
6. Combinations
Cross-analyse two participant types together
Find the most productive partnerships between two participant types. Currently covers Trainer + Jockey combinations — identify which pairings consistently deliver results and set a minimum winners threshold to cut out noise.
| Option | Choices |
|---|---|
| Combine | Trainer + Jockey |
| Min Winners | 2, 3, 5, 10 |
Filters available: Time Period, Race Type, Going
Example output: "Trainer jockey combination with 3+ winners in flat turf races this year"
7. IR Trading
In-running price vs BSP patterns
Find horses that show a consistent in-running trading pattern — specifically those whose Betfair price drops significantly from their BSP during the race. Useful for identifying horses that attract strong in-play support based on their recent record of doing so.
| Option | Choices |
|---|---|
| Dropped More Than | 30%, 40%, 50%, 60%, 70%, 80% from BSP |
| At Least | 2, 3, 4, 5, 6 times |
| Out of Last | 4, 6, 8, 10 runs |
| When | Today, Tomorrow |
Example output: "Show me horses running today that dropped more than 50% from their BSP in running 3 times out of their last 6 runs"
8. Cheltenham Festival
Festival trends, angles, and history
A dedicated recipe for the Cheltenham Festival with three modes of analysis: Festival-wide angles that examine cross-race trends, Race-specific trends that break down historical statistics for individual races, and a Qualifiers mode that profiles each declared runner against the trend data when declarations are available.
Stat badges are shown for the most relevant angles to give you an instant data snapshot before you run the query.
Mode 1: Festival-Wide Angles
These angles analyse the Festival as a whole across all races and years:
| Angle | What it analyses |
|---|---|
| Leaderboard | Top trainers, jockeys, or sires at the Festival by year, race type, and nationality |
| Previous Winners | How horses with prior Festival victories perform on their return |
| Dublin Form → Cheltenham | Horses that ran at the Dublin Festival and how they fared at Cheltenham |
| Graded → Festival Handicaps | Graded race form as a pointer for Festival handicap performance |
| Irish vs British Runners | Head-to-head record of Irish and British-trained runners at the Festival |
| Favourite Performance | How market leaders fare at Cheltenham across races and race types |
| Age Profile | Win rates by age group across Festival races |
| Course Form / Festival Experience | Impact of previous Cheltenham course experience on Festival performance |
| Last Time Out Winners | How horses that won their prep race perform at the Festival |
| Days Since Last Run | Whether freshness or match-fitness is an advantage at the Festival |
| Handicap Weight Analysis | Performance of top-weights and lightweights in Festival handicaps |
| Festival Trends & Overview | Broad trends covering the entire Festival (Irish dominance, going impact, etc.) |
| Year by Year History | Season-by-season breakdown of Festival winners and notable statistics |
Conditional filters: Race Type filter appears for Leaderboard angle; Year filter appears for Year by Year History
Mode 2: Race-Specific Trends
Select an individual race to see a detailed statistical breakdown across 16 categories. The recipe covers the major Festival races including Champion Hurdle, Gold Cup, Champion Chase, Stayers' Hurdle, Triumph Hurdle, Mares' Hurdle, Arkle, Brown Advisory, Ryanair, Ballymore, Supreme, Albert Bartlett, Champion Bumper, all six handicaps (Ultima, Coral Cup, Boodles, Grand Annual, County, Martin Pipe), and more. Use the optional Year filter to limit the analysis to a specific year.
| Section | What it shows |
|---|---|
| By Age | Win and place rates for each age group |
| Market Position | Performance by SP rank (favourite, 2nd fav, 3rd fav, etc.) |
| Nationality | Irish-trained vs British-trained vs French-trained |
| Last Time Out | Won LTO, Placed LTO, or Unplaced/No prev run |
| Days Since Last Run | Freshness bands from 0-14 days up to 91+ days |
| BHA Rating | Official rating bands (Unrated, Under 130, 130-139, 140-149, 150+) |
| Headgear | With or without headgear (blinkers, cheekpieces, etc.) |
| Beaten Fav LTO | Horses that were favourite but lost last time out |
| Country Bred | Where the horse was bred (IRE, GB, FR, Other) |
| Sex | Mares/Fillies vs Geldings/Colts |
| Course Experience | Previous Cheltenham form (any month) vs course debutants |
| Festival Experience | Previous Cheltenham Festival form (March only) vs Festival debutants |
| Prior Discipline Runs | How many runs the horse has had in the same discipline (chase, hurdle, NHF) |
| Season Runs | Number of runs since October 1 of the prior year |
| Won This Season | How many wins the horse has had this season |
| Weight Carried | Performance by weight band (handicaps only) |
Each section shows Runners, Wins, Win%, Places, and Place% for every bucket.
Mode 3: Qualifiers
When Festival declarations are available on RaceMetrics (typically the Sunday before the Festival), a Qualifiers button appears for race-specific trends. Click it to see a per-runner profile table showing how each declared runner maps to the trend categories above.
The qualifier table includes one row per declared runner with columns for:
- Horse — name and card number
- Age — horse's age
- OR — BHA Official Rating
- Headgear — whether headgear is worn
- Trainer Nat — trainer nationality (IRE/GB/FR)
- Bred — country of origin
- Sex — mare/filly or gelding/colt
- LTO — last time out result (Won/Placed/Unplaced)
- BF LTO — beaten favourite last time
- DSLR — days since last run
- Chelt Runs — prior Cheltenham runs (any time)
- Fest Runs — prior Festival runs (March only)
- Disc Runs — prior runs in the same discipline
- Season Runs / Wins — activity and wins since October 1
This lets you quickly cross-reference each declared runner against the historical trend data from Mode 2 and spot which runners fit the winning profile.
9. GBB Races
Great British Bonus race trends and leaderboards
The Great British Bonus (GBB) is an HBLB-funded scheme that rewards the breeding, buying, and racing of British-bred fillies with bonuses of up to £20,000 per race. GBB-eligible races are run across Flat, Hurdles, Chases, NHF, and All-Weather — over 15,000 races in the database since 2020.
This recipe lets you analyse who thrives in GBB races by leaderboarding trainers, jockeys, sires, and owners, or breaking results down by race type.
| Option | Choices |
|---|---|
| Angle | Top Trainers, Top Jockeys, Top Sires, Top Owners, Race Type Breakdown |
| Show Top | 10, 20, 50 |
| Ranked By | Strike Rate, Wins, Level Stakes Profit |
| Min Runners | 10, 20, 50 |
Example output: "top 20 trainers in gbb races by strike rate with at least 20 runners in flat races this year"
Available filters: Time Period, Race Type
10. Rider Restricted
Amateur and apprentice race statistics and systems
Rider Restricted Races are all-weather races limited to amateur, apprentice, and conditional jockeys (with or without a weight claim). There are around 142 races in the database since 2022 — a small but growing dataset with some strong statistical patterns.
Key findings: Market leaders strongly underperform (favourites return a ~29% loss to SP, A/E 0.74). LTO winners are heavily overbet (–40% loss in these races). Outsiders show better value at Betfair SP than at industry SP. The Jockey Meeting Rides angle surfaces the popular "5+ rides system" — jockeys with multiple rides at the meeting.
| Angle | What it analyses |
|---|---|
| Top Jockeys | Jockeys ranked by strike rate or wins in rider restricted races |
| Top Trainers | Trainers ranked by strike rate or wins — identifying those who specifically target these races |
| Top Owners | Owners with the best record in rider restricted races |
| By Price Range | Strike rate and profit/loss by market position — shows how poorly favourites perform |
| LTO Winners | How horses that won last time out perform in these races (strongly overbet) |
| Jockey Meeting Rides | Jockeys with 3, 4, 5, or 6+ rides at the same meeting — the basis of the "5+ rides system" |
Example output: "top 20 jockeys in rider restricted races by strike rate with at least 2 runners"
Available filters: Time Period only (all races are All-Weather)
Note: Min Runners defaults to 2 due to the smaller dataset size
11. Connections
Jockey and trainer angles for today's runners
Surfaces interesting jockey and trainer changes or situations on today's cards. Choose an angle to find runners where the connections have changed or where significant jockey/trainer patterns apply.
| Angle | What it finds |
|---|---|
| Jockey change | Horses with a different jockey compared to their last run |
| Jockey riding horse for first time | Jockey has never ridden this particular horse before |
| Jockey previously won on horse | Jockey has won on this horse in the past — a proven partnership |
| Jockey's first ride at track | Jockey making their first appearance at this course |
| Trainer change | Horses running for a new trainer compared to their last run |
| Trainers with only 1 runner today | Trainers sending just one horse to the meeting — may signal intent |
Optional filter: Limit results to a specific course from the full UK/Irish course list
Shared Filters
Available across multiple recipes as tab-based filter panels
Most recipes offer additional filter tabs to narrow results. Filters appear as clickable chips — select one or more to add conditions to your query. The Time Period filter is exclusive (only one can be active at a time); all others allow multiple selections.
| Filter | Options | Notes |
|---|---|---|
| Time Period | Today, This Week, Last 7 Days, Last 30 Days, Last 3 Months, This Year, Last Year, Last 2 Years, Last 5 Years | Exclusive — one at a time. Custom From/To date inputs also available |
| Race Type | Flat, Jumps, Turf, All Weather, Chases, Hurdles, Bumpers | Multi-select |
| Classification | Handicap, Non-Handicap, Maiden, Group 1, Listed, Nursery | Multi-select |
| Going | Heavy, Soft, Good to Soft, Good, Good to Firm, Firm | Multi-select |
| Runner | Favourites, 2yo, 3yo, Fillies | Multi-select |
| Festival | Dublin Festival, Cheltenham, Aintree, Royal Ascot, Goodwood, Galway | Multi-select — limits data to festival meetings only |
The Ask RaceMetrics page — the Query Recipes panel appears below the input box with 11 recipe cards to choose from
RaceMetrics Tips provides daily selections generated from a proprietary analytical model. Every tip comes with a full performance dashboard so you can independently verify the track record.
Accessing Tips
- Click Tips on the competition page, runners A-Z, dashboard, or profile tabs
- Or navigate directly to /tips
Today's Tips
- Published daily after breakfast prices are available (~7:45am)
- Each tip card shows the race time, course, horse name, field size, and breakfast price in fractional odds
- Click any tip card to open the full racecard for that race
- Before breakfast prices: If there are races today but tips haven't been published yet, you'll see "Today's tips will appear around 7:45am"
Performance Dashboard
The dashboard is visible to all users (including free tier) for full transparency. It tracks 6 staking methods:
- BF Win: Betfair Win at BSP (minus 2% commission)
- ISP: Industry Starting Price (level stakes)
- BF Place: Betfair Place at BPSP (minus 2% commission, terms vary by field size)
- Evening: Evening forecast price (level stakes)
- Breakfast BOG: Best Odds Guaranteed at breakfast price or ISP, whichever is higher
- Morning BOG: Best Odds Guaranteed at morning price or ISP, whichever is higher
Dashboard Views
- Cumulative P/L: Running total chart from 2019 to present across all 6 staking methods
- By Year: Yearly P/L breakdown with bar chart and detailed table
- By Month: Monthly P/L breakdown — x-axis shows year labels at each January
- By Price Band: ROI% grouped by starting price range (Odds-On through 16/1+)
- By Day of Week: P/L breakdown for each day of the week
All tables show the most recent period first and include a calculated TOTAL row.
Recent Results
A paginated table of the latest results showing date, course, horse (links to profile), finishing position, breakfast price, ISP, BSP, and key P/L columns. Non-finishers display their status (PU, FE, UR, etc.) instead of a position number.
RM Tip Badges
When viewing a racecard that contains tipped horses, an amber RM Tip badge appears next to the horse name in Ratings, Form Expert, and At-a-Glance views.
Subscription Access
- Free tier: Can view the full performance dashboard and recent results. Today's tips are blurred with an upgrade prompt. A Tips CTA button appears on the racecard Top Pick bar
- Basic and above: Full access to today's tips with prices and racecard links
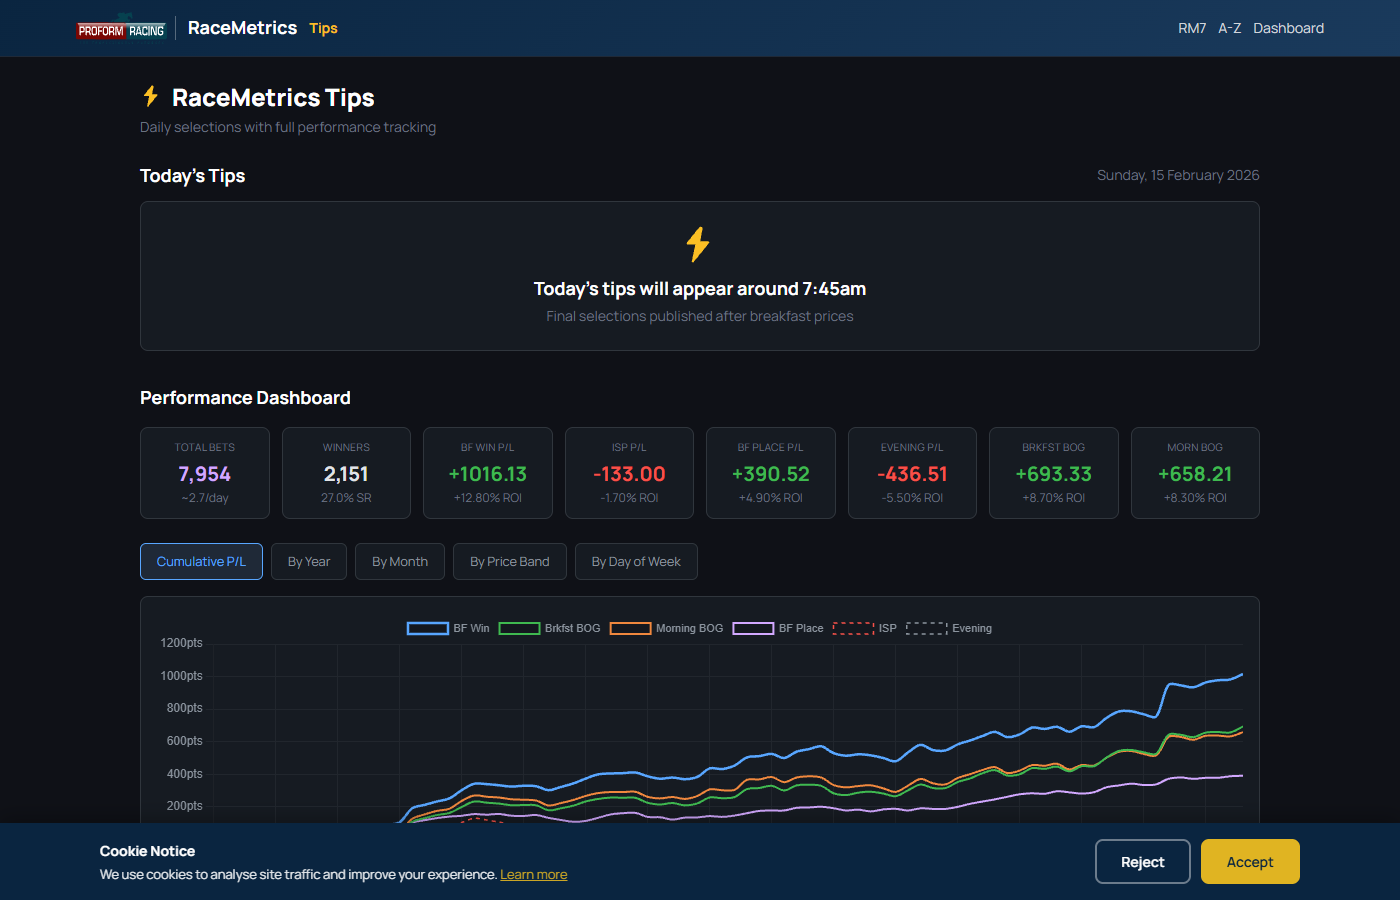
Tips performance dashboard showing summary statistics, P/L chart, and staking method breakdowns
Meeting Pace & Draw Analysis provides detailed sectional pace data and draw bias analysis for completed flat race meetings. It reveals how the pace unfolded, how each horse finished relative to par times, whether the track was favouring front-runners or closers, and whether certain draw positions had a significant advantage on the day.
Accessing the Page
- From any past racecard (a race with results), click the Meeting Pace button in the race header
- From the Dashboard results view, click the Meeting Pace Analysis pill next to a course with sectional data
- For Irish flat meetings (which do not have sectional data), a Meeting Draw Analysis button appears instead, showing draw bias analysis only
- Requires Platinum subscription with the Sectionals Add On
Two Modes
The page operates in two modes depending on data availability:
- Full mode (Meeting Pace Analysis): Available for GB meetings with sectional data. Shows pace bias, pace bars, runner sectional tables, and draw analysis
- Draw-only mode (Meeting Draw Analysis): Available for flat meetings without sectional data (e.g. Irish meetings). Shows draw bias analysis with per-race winner summaries and a collated draw summary table
Meeting Overview
The top of the page displays meeting-level bias badges:
- Pace Bias (full mode only): Whether the meeting favoured front-runners or closers, derived from winner running styles and placed horse distributions
- Draw Bias (both modes): Whether low or high draws dominated, based on winner draw positions relative to field midpoints
Draw Bias Badges
- Low Draw Bias: Majority of winners came from low stalls (at or below the field midpoint)
- High Draw Bias: Majority of winners came from high stalls
- Draw Advantage: Winners came from stalls with high historical Impact Values (above 1.50 average)
- No Draw Bias: Even spread of winning draws across the meeting
Draw & Stall Impact Values
Each runner's Draw column shows their stall number. Below it, the Stall IV (Impact Value) shows how that stall has performed historically at this course and distance over the previous 5 years.
- IV = 1.00 — the stall wins exactly as often as expected
- IV ≥ 1.30 (green) — significantly advantaged stall
- IV ≤ 0.70 (red) — significantly disadvantaged stall
IVs are calculated using the independent events method: for each stall, only races where that stall had a runner are considered. This correctly accounts for the fact that higher-numbered stalls only appear in larger fields. The formula is: IV = (wins / races_with_stall) / (races_with_stall / total_runners_in_those_races). A minimum of 5 qualifying races is required before a stall IV is shown.
Baselines are calculated from the 5 years of results prior to the meeting date, so they reflect only what was known at the time of the meeting.
Draw Summary Table
Below the race cards (or the per-race summaries in draw-only mode), a Draw Summary table collates the draw data across all flat races at the meeting:
- Winner Draw: The stall the winner came from in each race
- Stall IV: The historical Impact Value for that winning stall, colour-coded green (≥1.30) or red (≤0.70)
- Low/High: Whether the winner's stall was below or above the field midpoint
- Totals row: Overall counts and average winner IV across the meeting
Race Cards (Full Mode)
Each race is displayed as a card showing:
- Race header: Time, race name, class, distance, going, number of runners, and the Finishing Speed Percentage (FSP) for the race
- Pace bar: A colour-coded bar split into furlong sections. Each section is coloured by how it compared to par time — green for faster than par, red for slower, with intensity showing magnitude
- Early Pace label: Categorises the first half of the race (e.g. Fast, Steady, Average)
Runner Table (Full Mode)
Below each pace bar, the runner table shows per-horse sectional performance:
| Column | Description |
|---|---|
| Pos | Finishing position |
| Horse | Horse name (clickable to open profile) |
| Draw | Stall position. The number below is the historical Impact Value for that stall at this course and distance (green = advantaged, red = disadvantaged) |
| SR | Proform Speed Rating achieved. Value in brackets shows difference to Class Par |
| Style | Running style classification with icon (e.g. FR, PROM, STK, MID, CLO, HU) |
| Pos Track | Position at key race stages showing how the horse travelled through the field |
| +/- | Net positions gained or lost from start to finish. Green = gained, red = lost |
| FS 2f | Finishing Speed percentage difference vs par at 2 furlongs out. The most reliable effort indicator. Hover for mph |
| FS 1f | Finishing Speed percentage difference vs par at 1 furlong out. Hover for mph |
| FS Fin | Finishing Speed percentage difference vs par at the finish. Use with caution — easing down can distort. Hover for mph |
Finishing Speed Columns
The FS columns show how each horse's speed at 2f out, 1f out, and the finish compared to par:
- Positive values (green): Faster than par — the horse was finishing strongly
- Negative values (red): Slower than par — the horse was weakening
- Near zero: Running close to the expected pace for that section
- Hover over any value to see the actual speed in miles per hour
Pace Bar Colour Key
- Green: Section run faster than par (darker = much faster)
- Red: Section run slower than par (darker = much slower)
- Grey: Close to par (within ±0.2 seconds)
Hover over the pace bar to see a detailed breakdown of each section's time difference from par, race conditions, and the early pace classification.
Theme Toggle
A light/dark theme toggle is available in the top-right corner. The page uses its own independent theme setting that is remembered across sessions.
Account
Manage your RaceMetrics account and preferences from the account page.
Accessing Settings
Click your username or profile icon in the top-right corner, then click the settings cog icon to access the Account Settings page.
Account Information
Displays your registered email address and name.
Competition Display Name
Set the name that appears on the RM7 competition leaderboard. Click Save after changing.
Change Password
Update your password by entering:
- Current password
- New password (minimum 6 characters)
- Confirm new password
Click Update Password to save changes.
Preferences
How should links open?
- New Tab: Opens racecards and profiles in a new browser tab
- New Window: Opens in a popup window
- Same Window: Replaces the current page
Price Format:
- Fractional: Traditional UK odds (e.g., 5/2, 11/4, 7/1)
- Decimal: European format (e.g., 3.50, 3.75, 8.00)
Tooltips:
- On: Show explanatory hover cards on table headers and stats
- Off: Disable tooltip popups
Subscription
Shows your current subscription status and options:
- Subscription tier badge showing your current plan
- Renewal or expiry date
- Change Plan: Upgrade or downgrade your subscription
- Manage Subscription: Update payment method, view invoices, or cancel
- Compare All Plans: See features and pricing for all tiers
Note: Upgrades take effect immediately with prorated billing. Downgrades take effect at the end of your billing period.
RaceMetrics provides real-time notifications to keep you informed about important updates. Notifications appear via a bell icon in the header and optional toast popups.
The Notification Bell
When logged in, you'll see a bell icon in the header next to your name. The bell shows:
- Red badge: Number of unread notifications (up to 99+)
- Dropdown panel: Click the bell to see recent notifications
- Mark All Read: Clear all unread indicators at once
Click any notification to view more details or navigate to the relevant page.
Notification Types
You can receive notifications for the following events:
- Non-Runners: Alerts when horses are withdrawn from upcoming races
- Going Changes: Updates when the going description changes at a course
- New Racecards: Daily notification when tomorrow's racecards are available
- Results Updated: Notification when race results and ratings have been processed
- Sectionals Available: When sectional timing data is imported (Platinum only)
- Price Updates: Evening (8:30pm), breakfast (7:30am), and morning (10:30am) price updates
- Competition Updates: When RM7 competitions open or leaderboards are updated
- New Features: Announcements about new site features and improvements
Toast Popups
Toast notifications appear briefly in the corner of your screen when new notifications arrive. They automatically disappear after a few seconds, or you can dismiss them manually.
Managing Preferences
Customise your notification experience from the Account Settings page:
- Bell Icon: Toggle the notification bell on/off
- Toast Popups: Enable/disable popup notifications
- Categories: Choose which notification types you want to receive
Go to Account Settings (click the cog icon) and scroll to the Notification Preferences section to configure these options.
Real-Time Delivery
Notifications are delivered in real-time using Server-Sent Events (SSE). This means you'll receive updates instantly without needing to refresh the page. If your connection is interrupted, notifications will automatically reconnect.
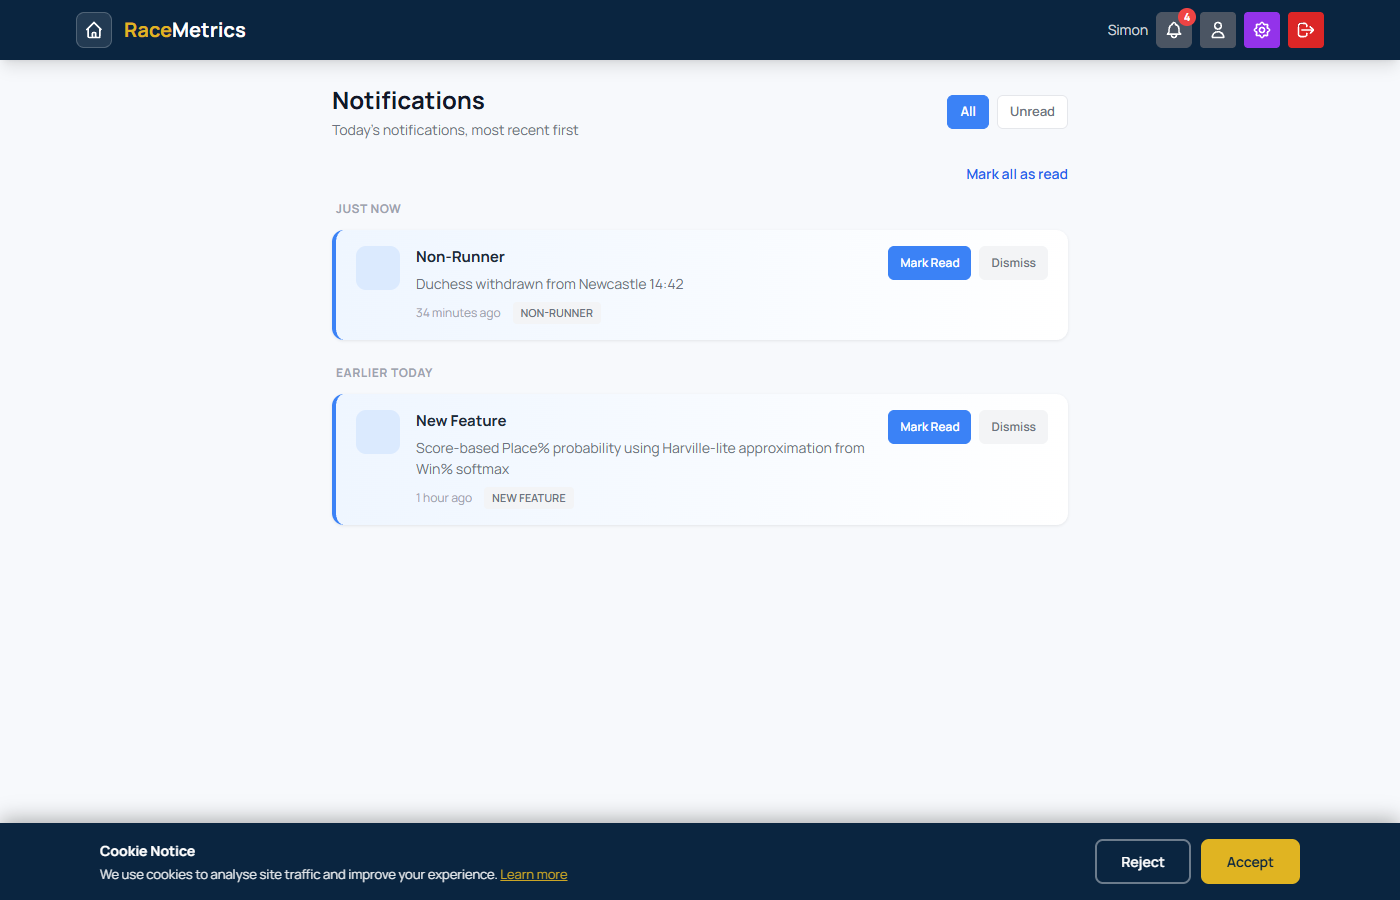
Notifications page showing non-runner alerts, feature announcements, and other notification types with read/dismiss controls
RaceMetrics offers several subscription tiers to suit different needs.
Free Tier
- 5 saved patterns
- 10 profile views per day
- 1 meeting per day for racecards
- Access to leaderboards
- RM7 competition entry
Basic (£10/month)
- 10 saved patterns
- 20 profile views per day
- All racecards
- A-Z runners access
Standard (£15/month) - Most Popular
- 50 saved patterns
- 100 profile views per day
- All features included
Expert (£20/month)
- 250 saved patterns
- 500 profile views per day
Enterprise (£25/month)
- 1,000 saved patterns
- 5,000 profile views per day
Upgrading Your Plan
When you upgrade to a higher tier:
- You'll be charged a prorated amount for the remainder of your billing period
- Your new features are available immediately
- Your billing date stays the same
Downgrading Your Plan
When you downgrade to a lower tier:
- The change is scheduled for the end of your current billing period
- You keep your current plan's features until then
- The new lower rate starts on your next billing date
Cancelling Your Subscription
To cancel your subscription:
- Go to Account Settings and click "Manage Subscription"
- This opens the billing portal where you can cancel
- Access continues until the end of your billing period
- Your account then reverts to the free tier
Payment Issues
If a payment fails, your subscription will be cancelled and your account will revert to the free tier. You can resubscribe at any time from your account settings.
Frequently Asked Questions
Looking for more? The full Knowledge Base has every Q&A we maintain — built from real customer questions, with dated, linkable answers.
Ratings are updated daily after racing concludes. Results from each day's racing are processed overnight, so you'll see updated ratings reflecting yesterday's results each morning.
RaceMetrics uses official racing data covering UK and Irish racing. Our database includes comprehensive historical performance data. P/L calculations use Betfair Starting Prices (BSP) for accurate profit tracking.
Daily limits (profile views) reset at midnight UK time. If you reach your limit, you can either wait for the reset or upgrade to a higher tier. Pattern limits are total (not daily) and can be increased by upgrading your subscription.
Yes, you can upgrade or downgrade your subscription at any time from your account settings. Upgrades take effect immediately with pro-rated billing. Downgrades take effect at the end of your current billing period.
Yes, RaceMetrics 7 is completely free to enter for all registered users. There is no purchase or subscription requirement - even free tier users can compete for the weekly cash prizes. It's a skill-based competition, not gambling.
Patterns are saved from profile pages. When viewing statistics (e.g., a trainer's record at a specific course), look for the "Save Pattern" button. This creates a pattern with those conditions that will alert you when matching runners appear on racecards.
P/L shows the theoretical profit or loss if you had backed every runner to £1 stakes at Betfair Starting Price (BSP). This gives a standardised measure of value performance, removing the subjectivity of individual price judgements.
Contact & Support
We're here to help! If you can't find the answer you need in this documentation, there are several ways to get support:
Contact Us
- Email: admin@racemetrics.co.uk
- Contact Form: Submit a support request
- Twitter/X: @proform_racing
Response Times
We aim to respond to all support enquiries within 24 hours during business days (Monday-Friday).
Feedback
We're always looking to improve RaceMetrics. If you have suggestions for new features or improvements, please let us know via the contact form.